

Loki-100G-5S-1P
New 5-speed dual-media test module
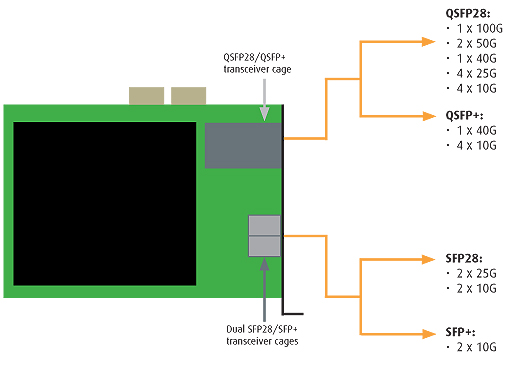
The new Xena Networks test module Loki-100G-5S-1P is a versatile test solution offering five different Ethernet network speeds: 10GE, 25GE, 40GE, 50GE and 100GE. This unique test module lets users dynamically choose between two different physical transceiver cages and form factors. The first is a single QSFP28/ QSFP+ transceiver cage, and the second is two SFP28/ SFP+ transceiver cages.
When using the QSFP28/ QSFP+ cage, the user can dynamically select between the following modes of operation: 4x10GE / 1x40GE / 4x25GE / 2x50GE / 1x100GE test ports, and when using the dual SFP28 cages: 2 x 10GE / 2x25GE.
The unique combination of five different Ethernet network speeds and multiple physical optical transceiver form factors, makes the Loki-100G-5S-1P a versatile solution for performance and functional testing of network infrastructure and Ethernet equipment such as taps, switches, routers, NICs, packet-brokers, and backhaul platforms.
One module – multiple options
The Loki-100G-5S-1P lets you dynamically choose between 2 transceiver cages. This determines which speeds and number of ports you can use. Once the physical transceiver cage is in use, you can use ValkyrieManager (Xena’s free traffic generation and analysis software) to specify which Ethernet speeds to use.
Unique Eye Diagram
The new Xena Networks 5-speed dual-media test module Loki-100G-5S-1P includes a unique feature for analyzing signal quality called the “eye diagram”. When using the QSFP28 ports, an additional panel called “Advanced PHY Features“ will appear in the main Resource Properties tab of ValkyrieManager. This panel controls and monitors the four receive SerDes associated with the 4x10G or 4x25G link at the physical level. It also creates bit-error-rate (BER) eye diagrams, estimates the link BER from the vertical and horizontal BER bathtub curves and controls the PHY tuning in the transmit and the receive directions.
How it works
The BER eye-diagram provides a direct visual representation of the signal quality after RX equalization. The eye-diagram is formed by changing the time dimension (sampling delay) and the amplitude dimension (0/1 threshold) of the sampling point of the PHY step-by-step. For each sampling point (x,y), 1 million bits are measured, the number of bit-errors are counted and a simple division gives the BER. The result is the BER eye-diagram (see below).
The color map shows the measured bit-error rate for each point going from 1 million (maximum red) to zero (black). The color scale is logarithmic. Higher resolutions give a clearer diagram and higher values of X and Y will also give a higher precision in the vertical and horizontal bathtub curve estimations, respectively.
What it shows
The eye-data table provides an estimate of several parameters of the eye, including width, height and jitter. Future releases will also include link BER estimates based on the horizontal and vertical bathtub curves.
See here for more information on the “eye” diagram feature.
