Overview of the Allegro Analysis Modules

Overview of the Allegro Analysis Modules

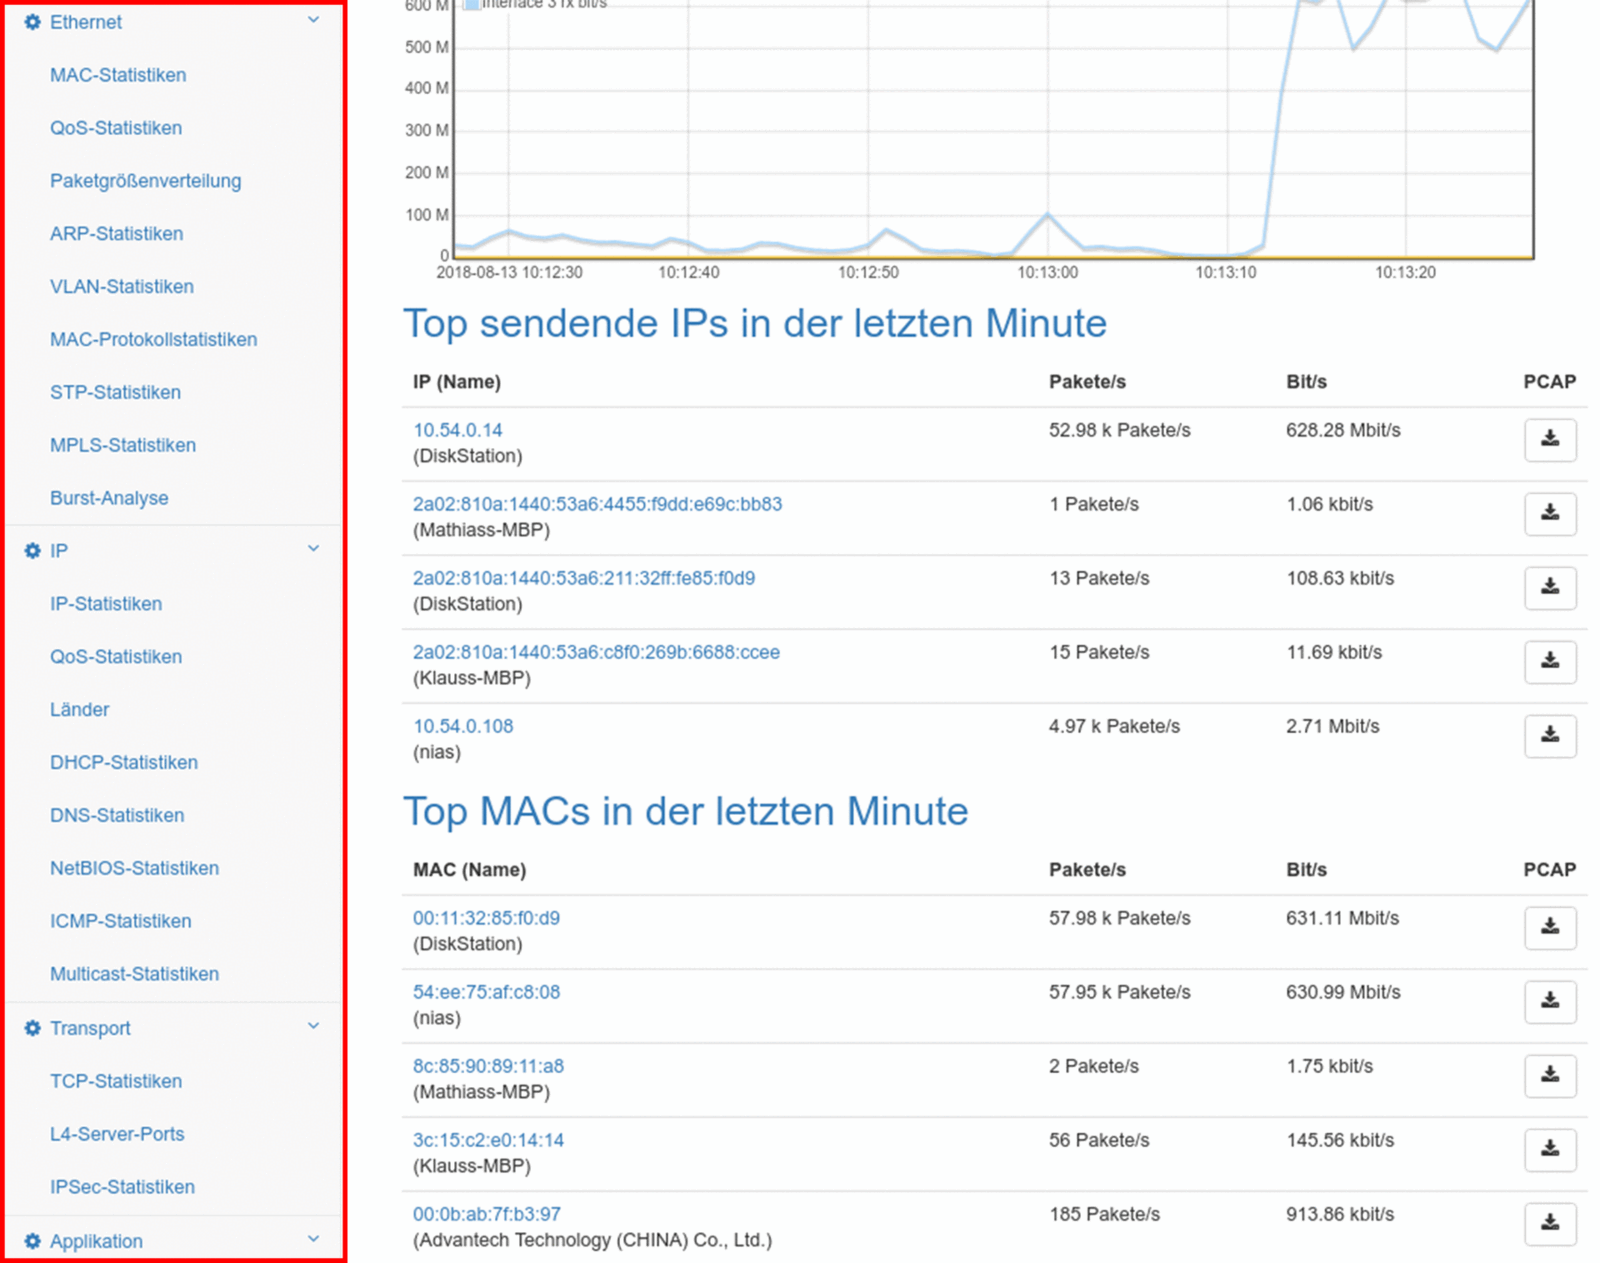
The Allegro Network Multimeter’s intuitive web interface provides comprehensive overviews of all important network traffic parameters.it displays all important quality metrics such as packet loss and jitter globally and has integrated analysis for SIP and RTP connections.Certain network events are automatically analysed by the Allegro Network Multimeter and warnings are sent by email if network errors occur.

Real-time Measurement of all Parameters

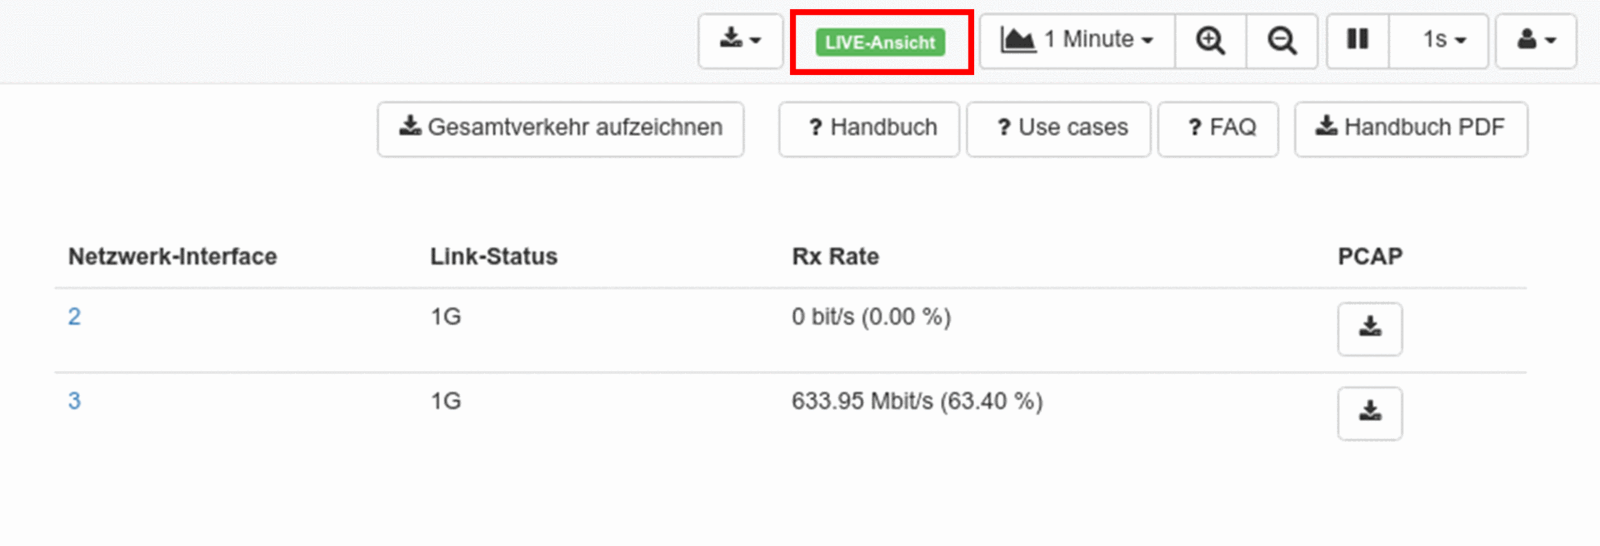
The Allegro Network Multimeter analyzes all network traffic parameters in real-time. All statistics are available without any waiting time. This allows the administrator to navigate through the statistics in seconds. The display is accurate to the second. Depending on the analysis module selected, even more precise intervals (in the microsecond range) are possible.


Real-time Statistics per Graph

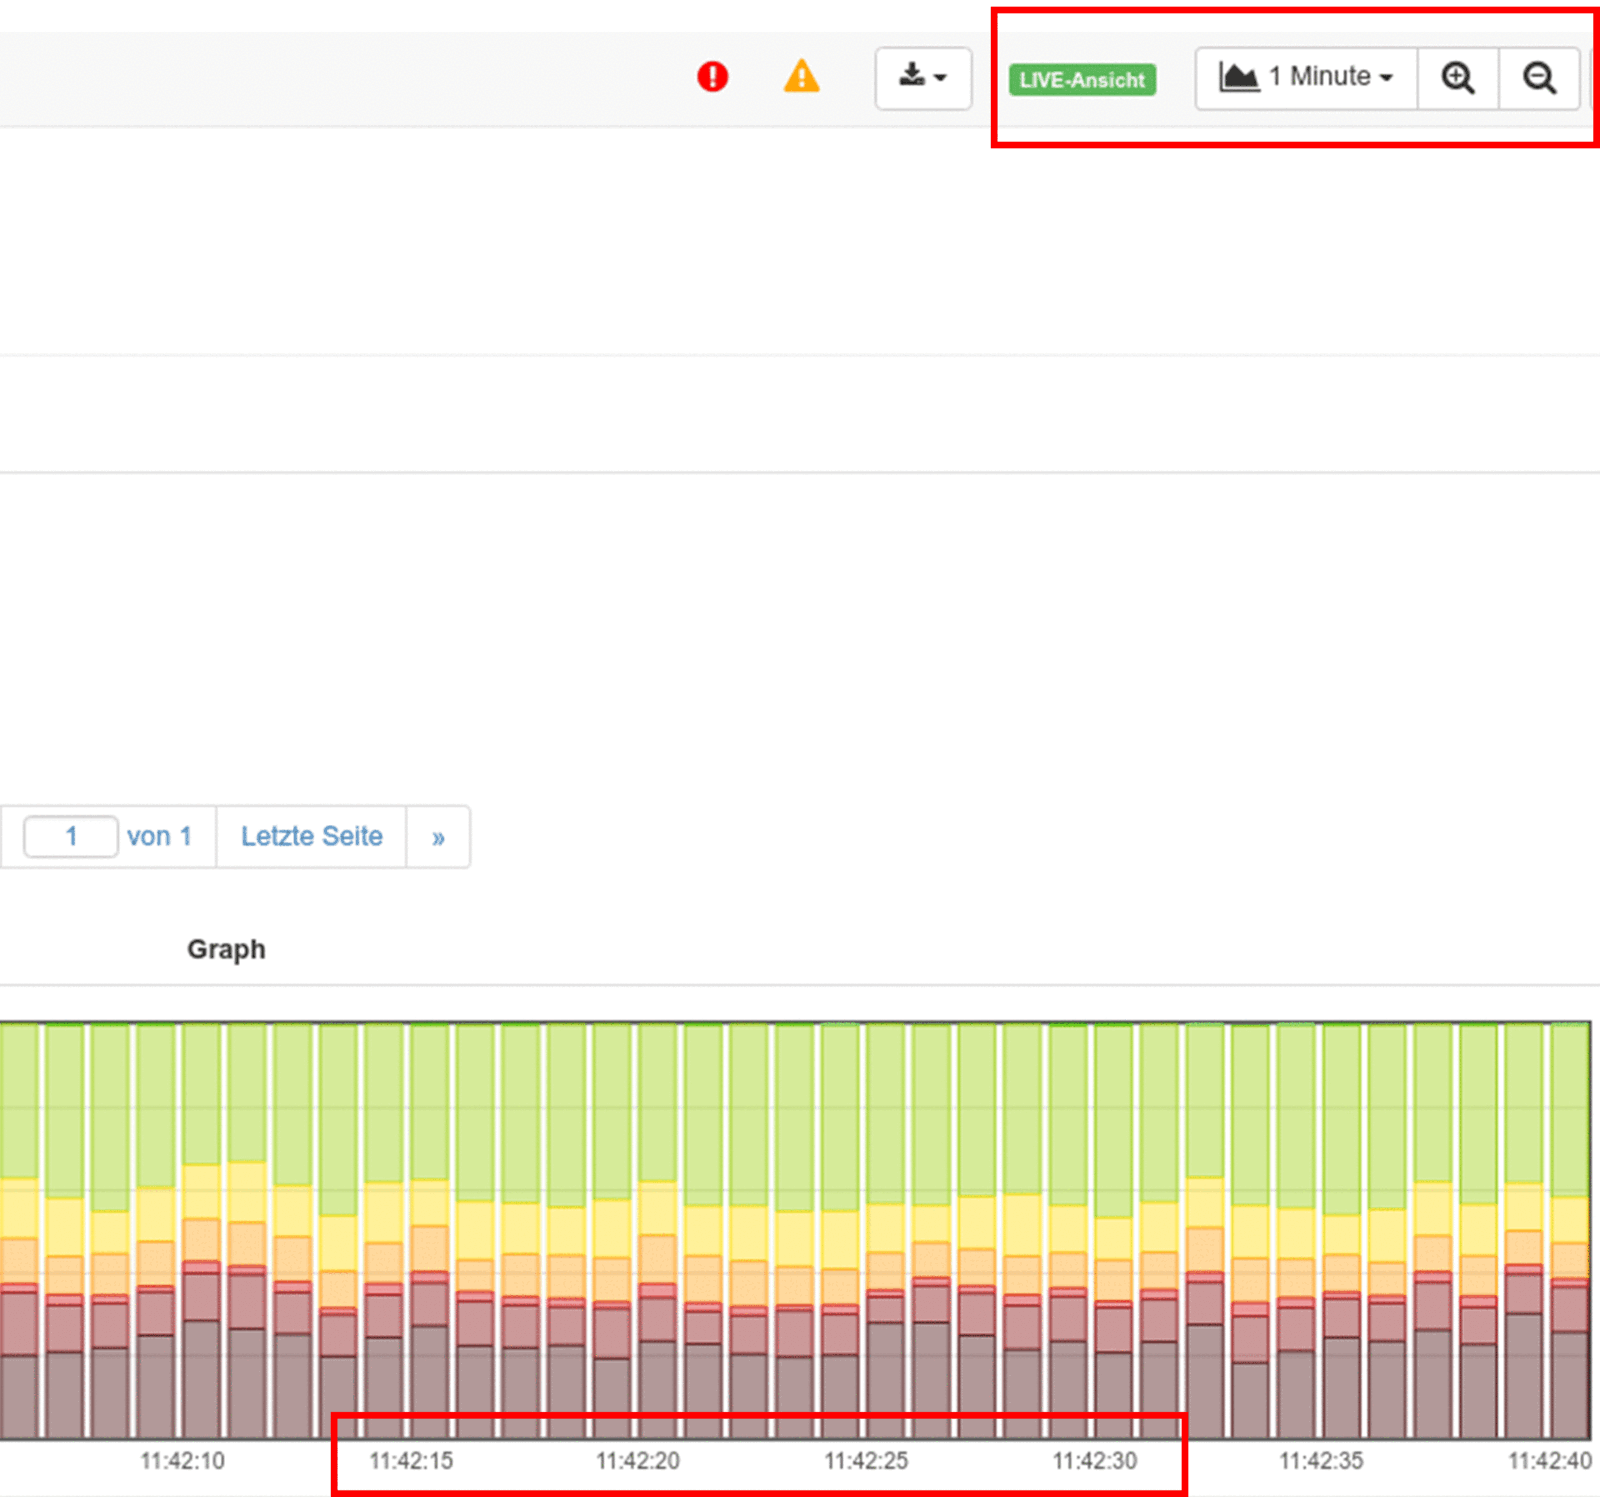
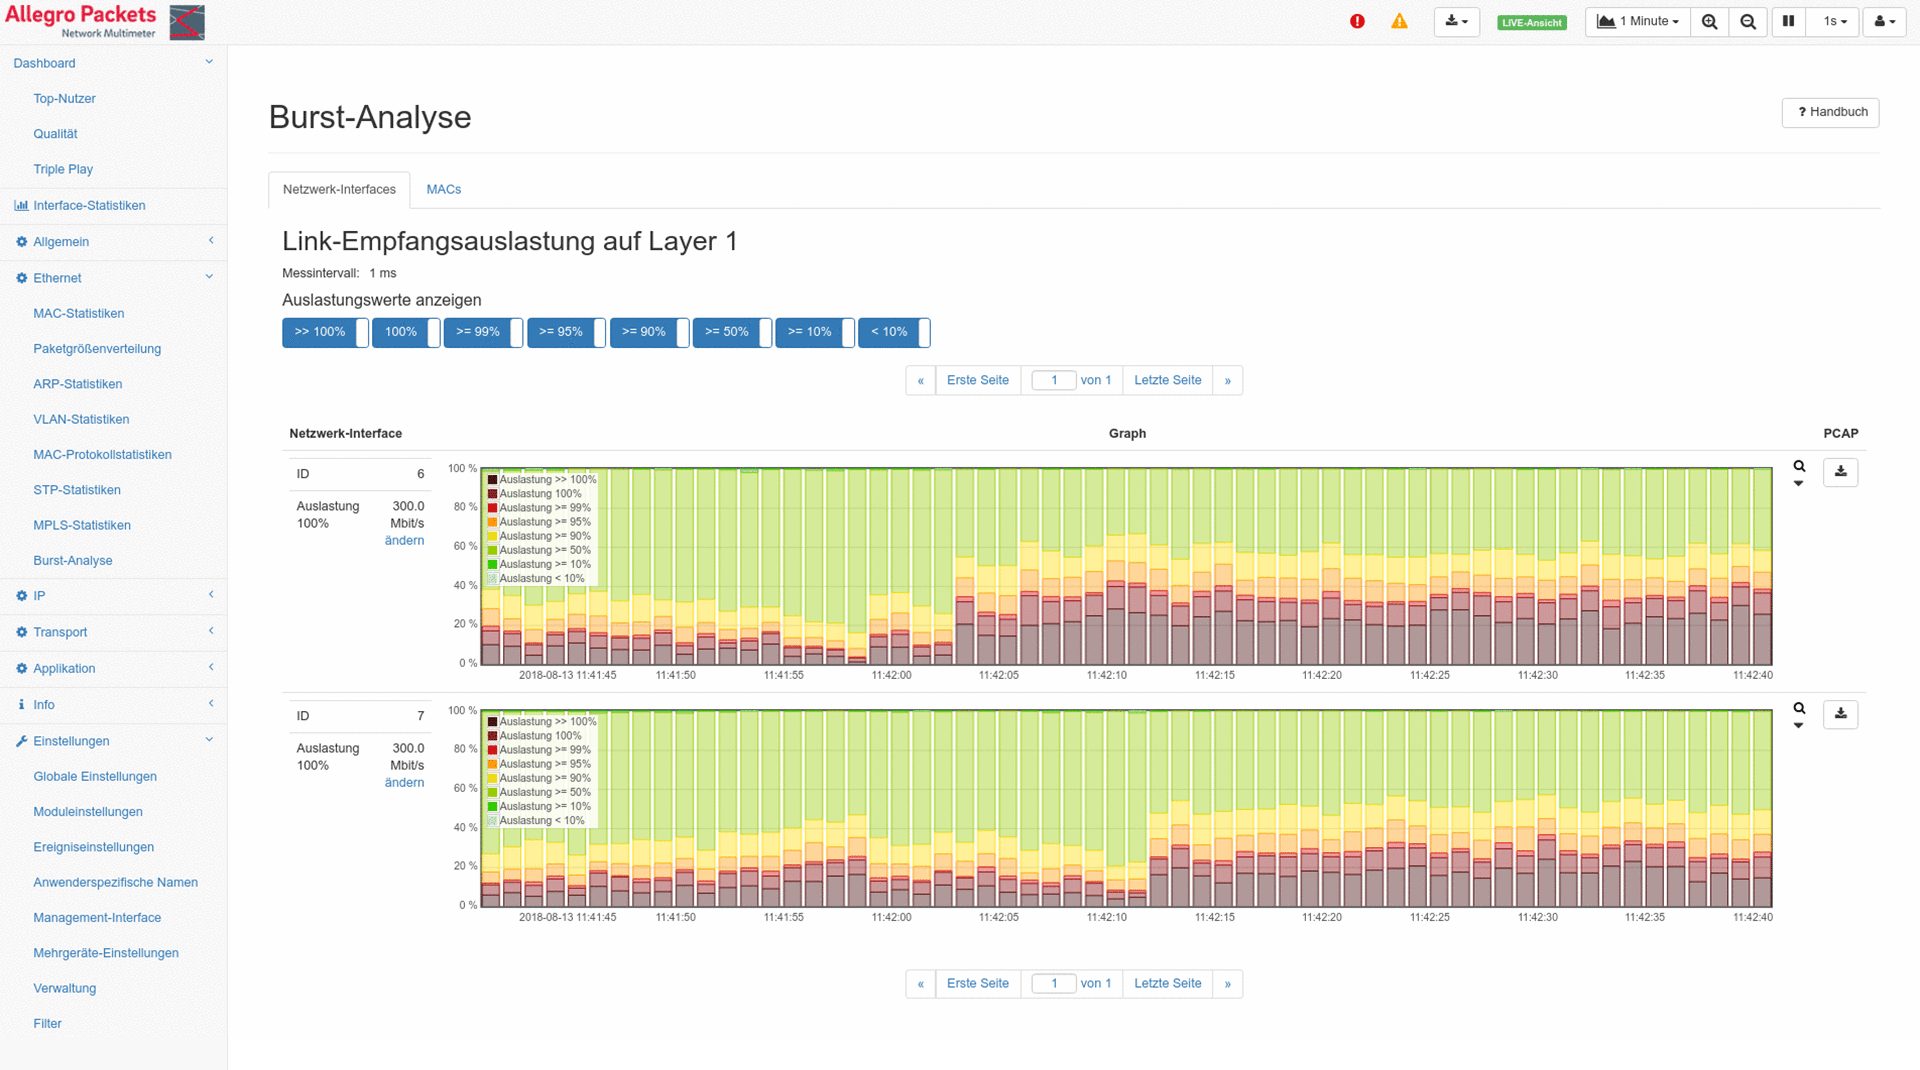
Many statistics are displayed in real-time using detailed graphs (for example, real-time port usage display). The capacity utilisation of a port is determined and displayed aggregated in measurement intervals with a resolution of up to one millisecond. In the example, the configurable threshold of 350 Mbit/s was exceeded by 11:44:11 for 200 ms. A conventional display with a much lower resolution in the seconds range would indicate a lower load than actually occurred.
 

Subsequent Statistics

Often problems in the network are brought to the attention of network administrators long after an event. Equipped with the Pcap ring buffer, the Allegro Network Multimeter allows you to see even the most historic events – also providing real-time analysis. The Allegro Network Multimeter can be used to quickly investigate the traffic that occurred in the network at a specific point in time. This means that a pcap of the burst can be generated and subsequently read.
Comprehensive VLAN Analyses at a Glance

VLAN Overview

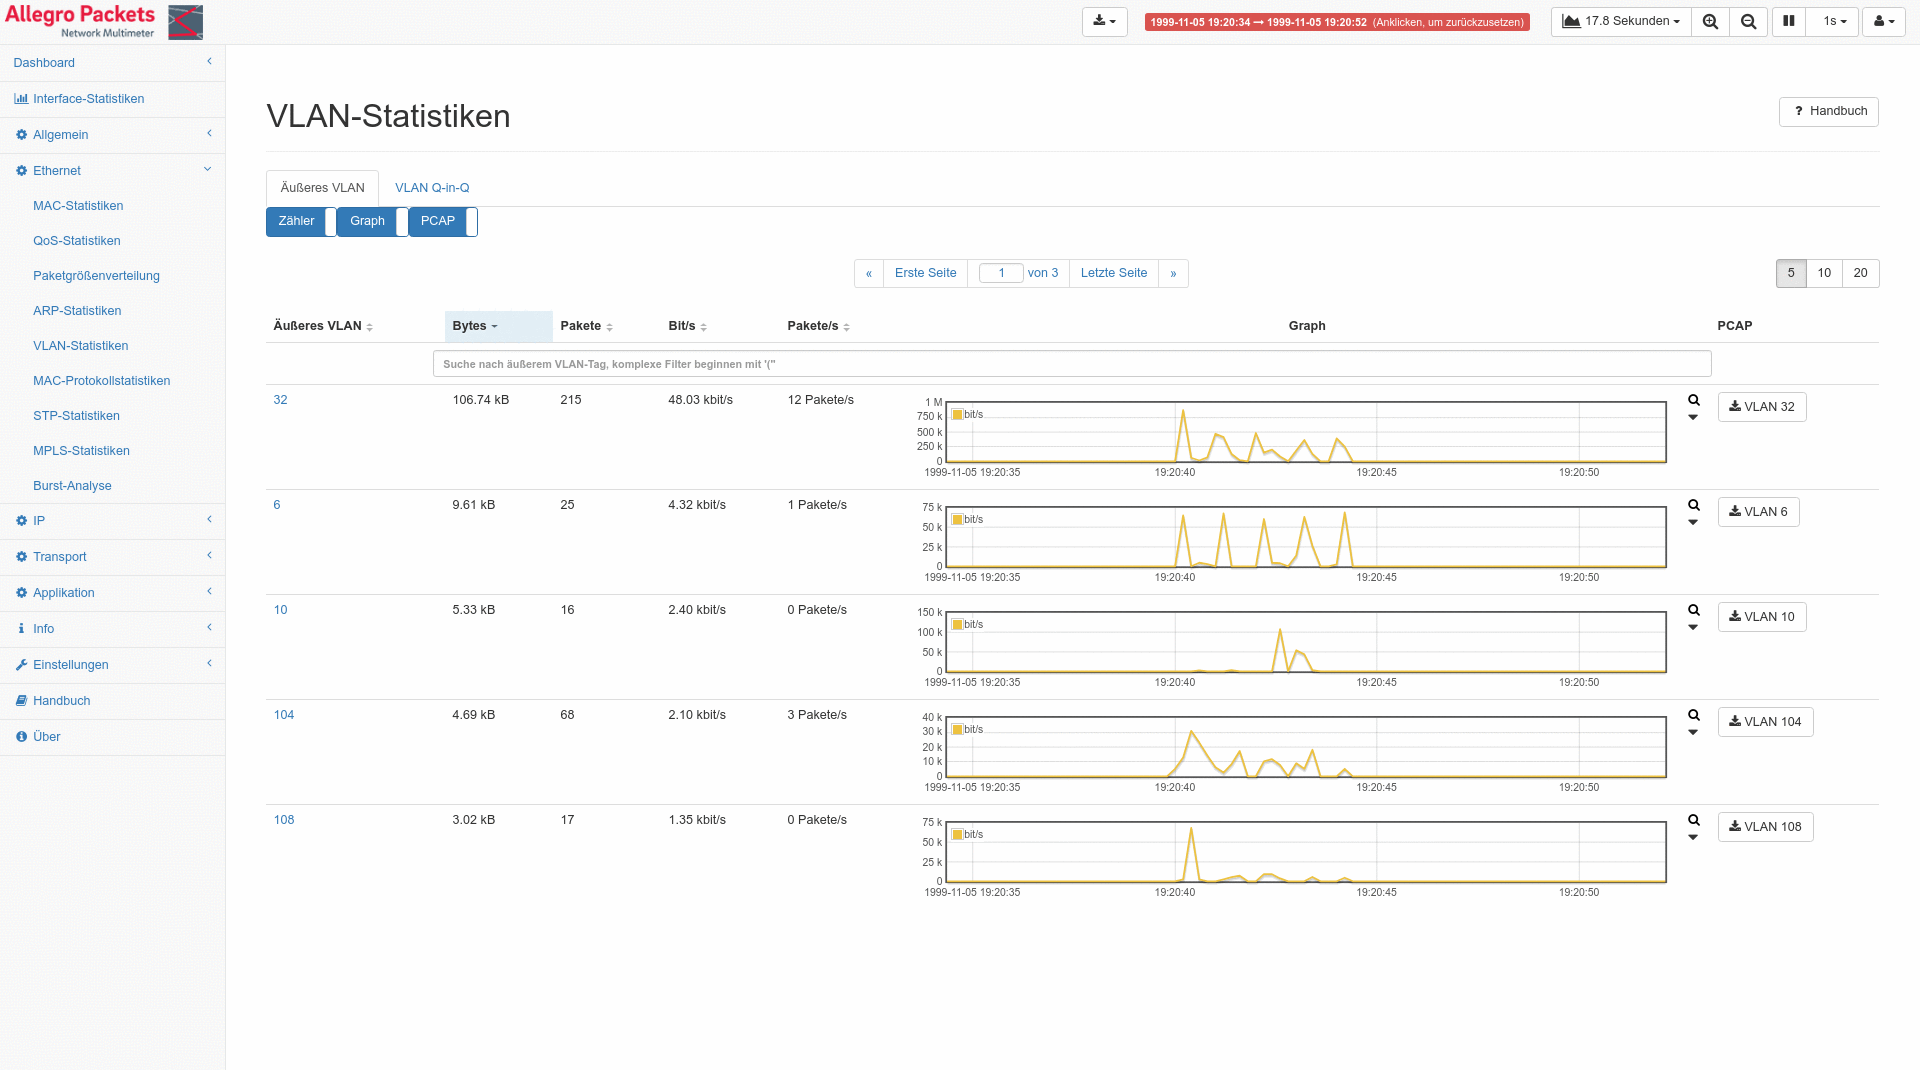
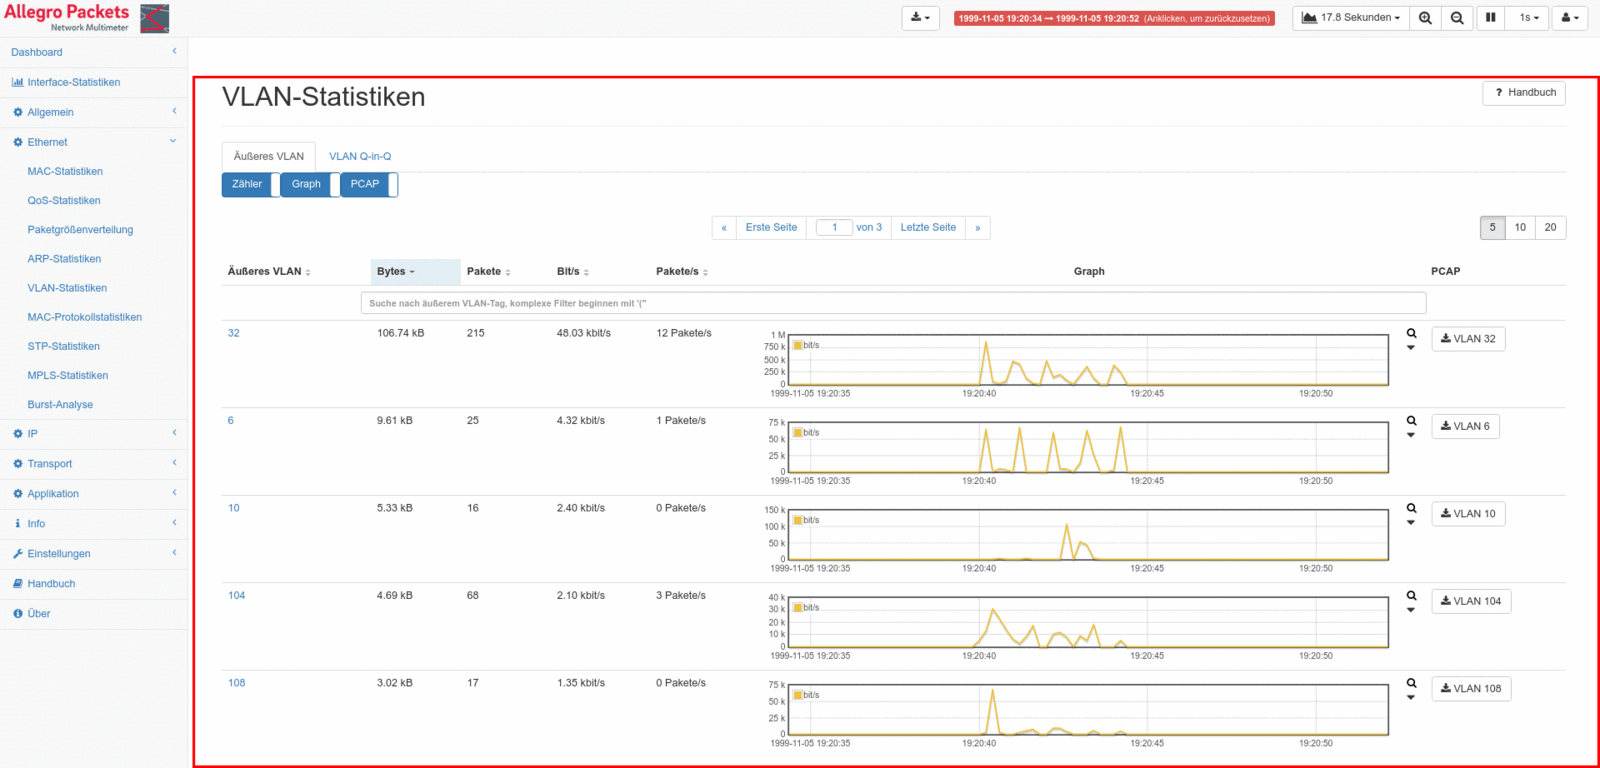
The Allegro Network Multimeter provides information about all enabled VLANs. This provides a simple overview of all active VLANs and their load in real-time or in the past. For example, a peak load can easily be limited to a VLAN. For mixed traffic with and without VLANs, the traffic without VLANs is also displayed, which allows an analysis of tagged and untagged VLAN traffic.


VLAN Details per MAC

The Allegro Network Multimeter displays all MAC addresses per VLAN including one throughput graph per MAC address. These can be easily filtered by manufacturer and sorted by packets, bytes or even bits/s. This allows the top MAC addresses within a VLAN to be determined quickly and easily. As with all graphs, this is also possible for a specific time interval.


Q-in-Q VLAN

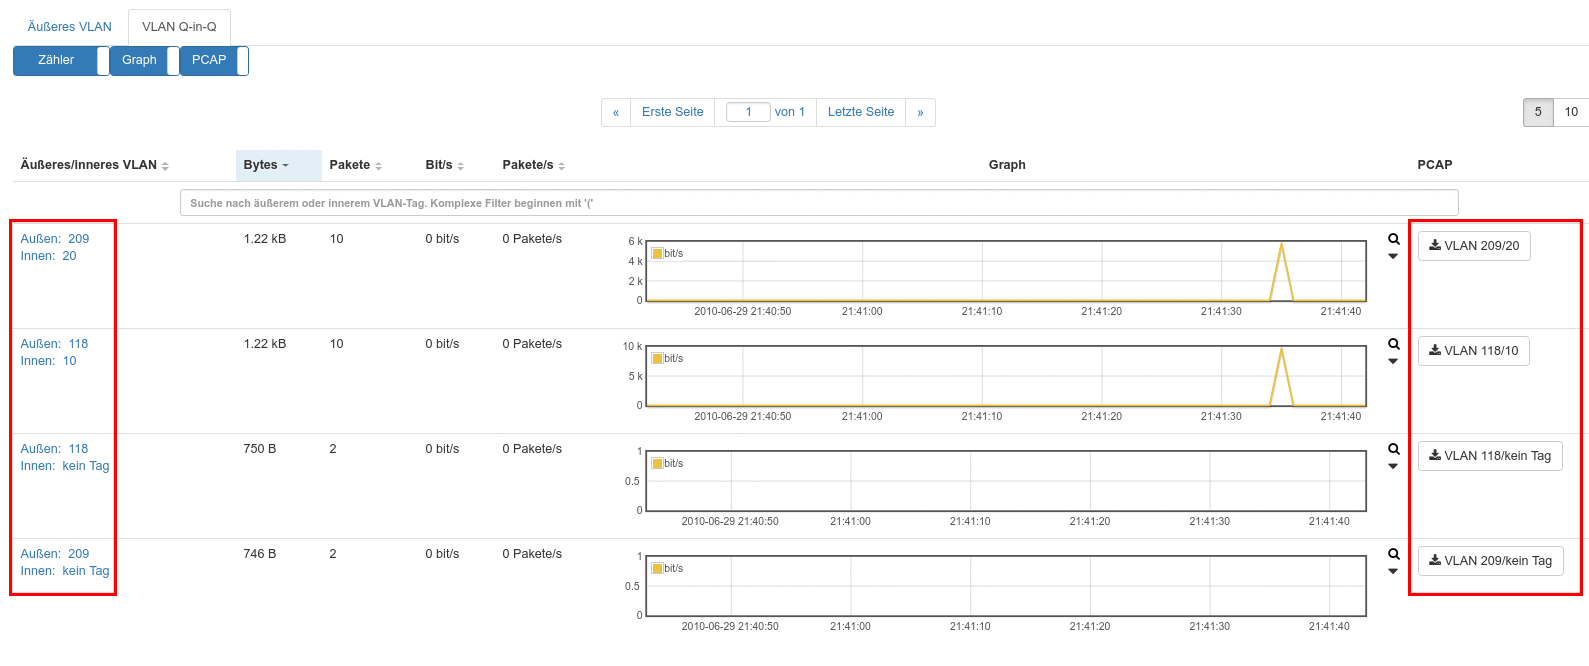
VLAN analysis is available for both single-tagged VLANs and 802.1ad Q-in-Q VLANs. Within double-tagged VLANs, even the TOP inner VLAN to an outer VLAN can be searched and filtered.


VLAN Pcap Extraction

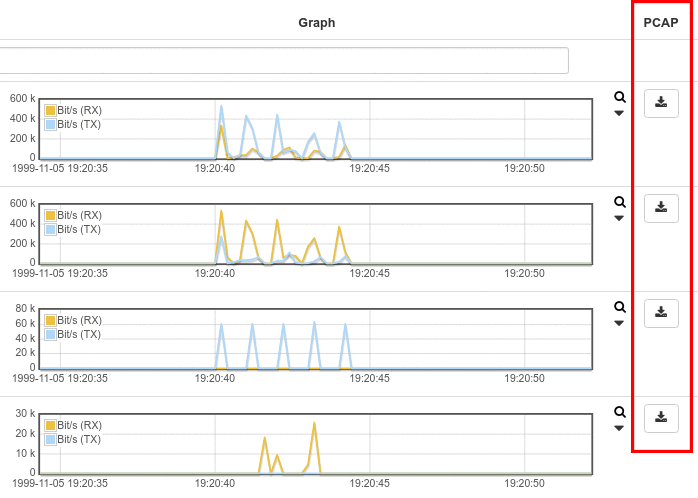
For all VLAN functions described above, real-time pcap extraction is available for current and past network traffic. A pcap can be generated for single VLANs, double-tagged VLANs or for the traffic of a MAC address in a VLAN.

Synchronous Measurement and Monitoring


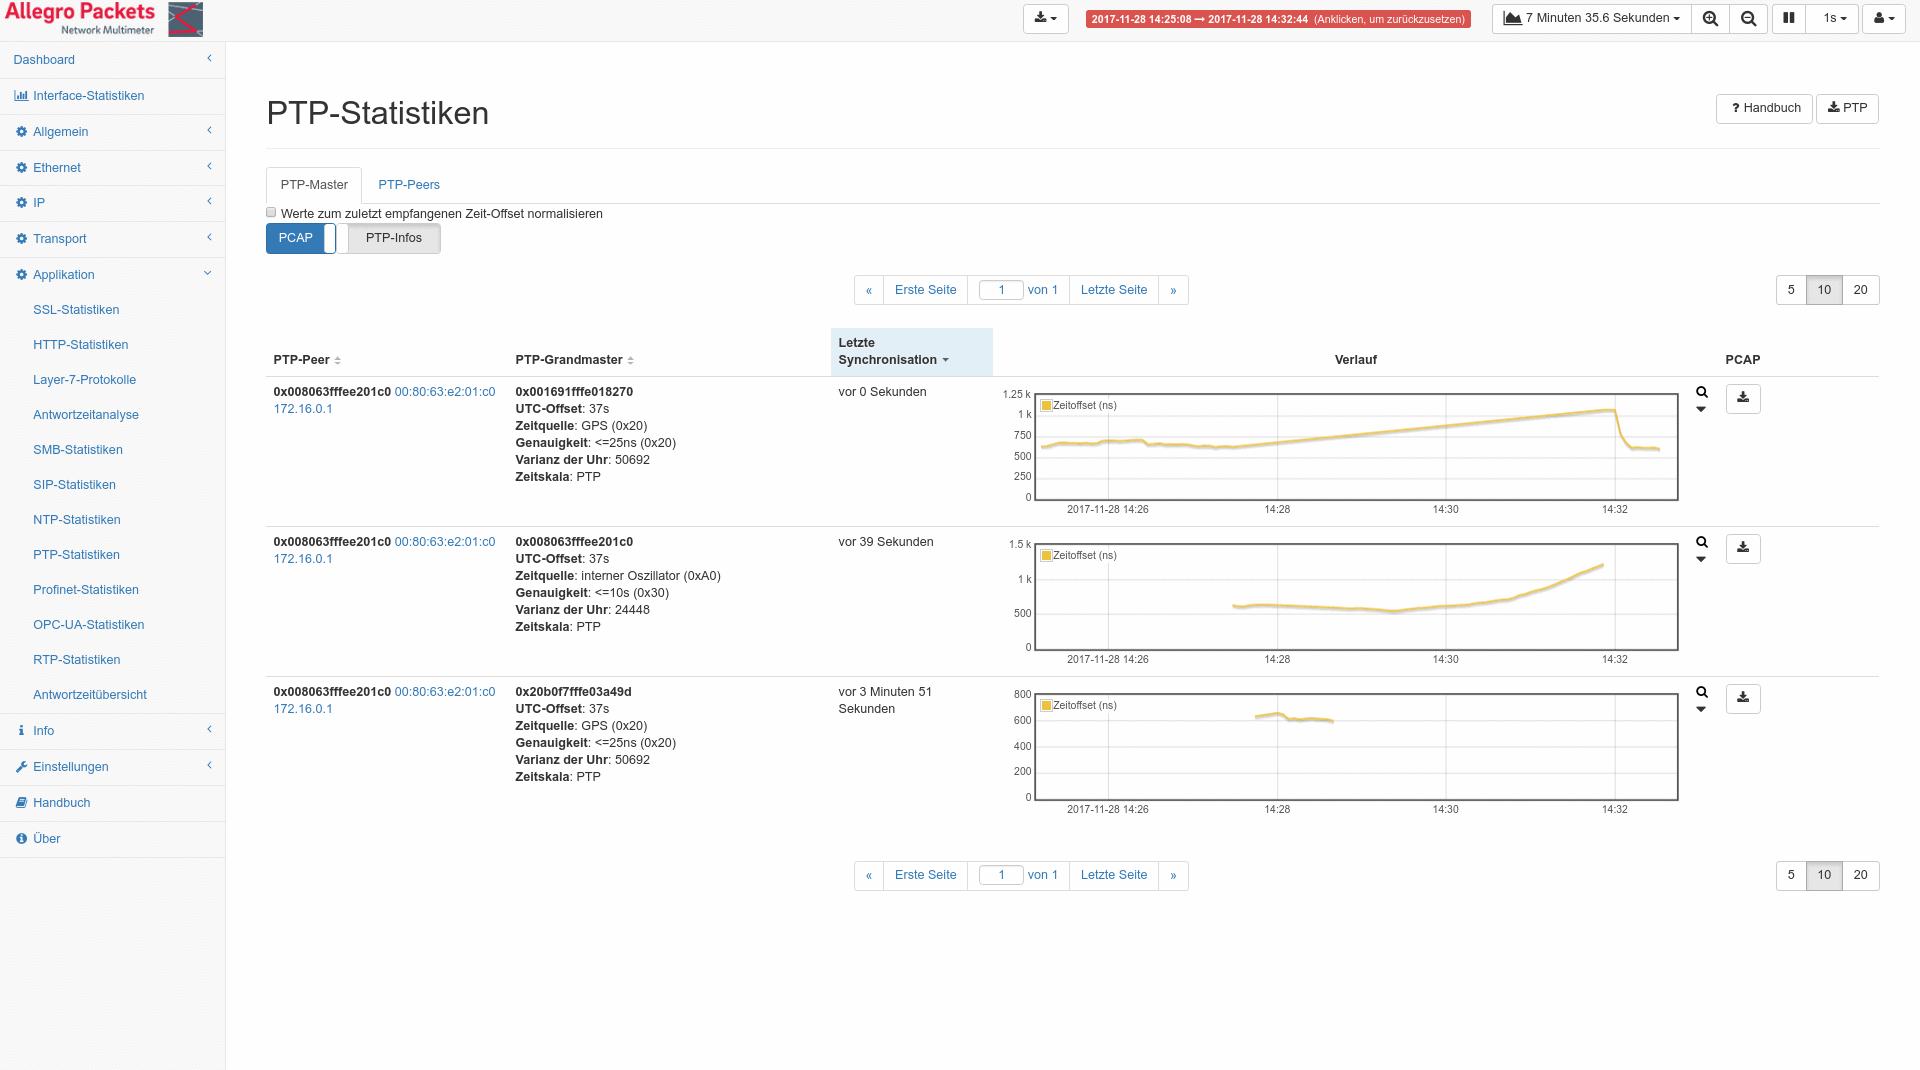
Synchronization in the Sub-microsecond Range

The Precision Time Protocol (PTP) is a network protocol that synchronizes the time settings of multiple devices on a computer network. PTP performance allows synchronization in the sub-microsecond range, provided that all network components support the corresponding standard.

Monitoring of VoIP Call Quality

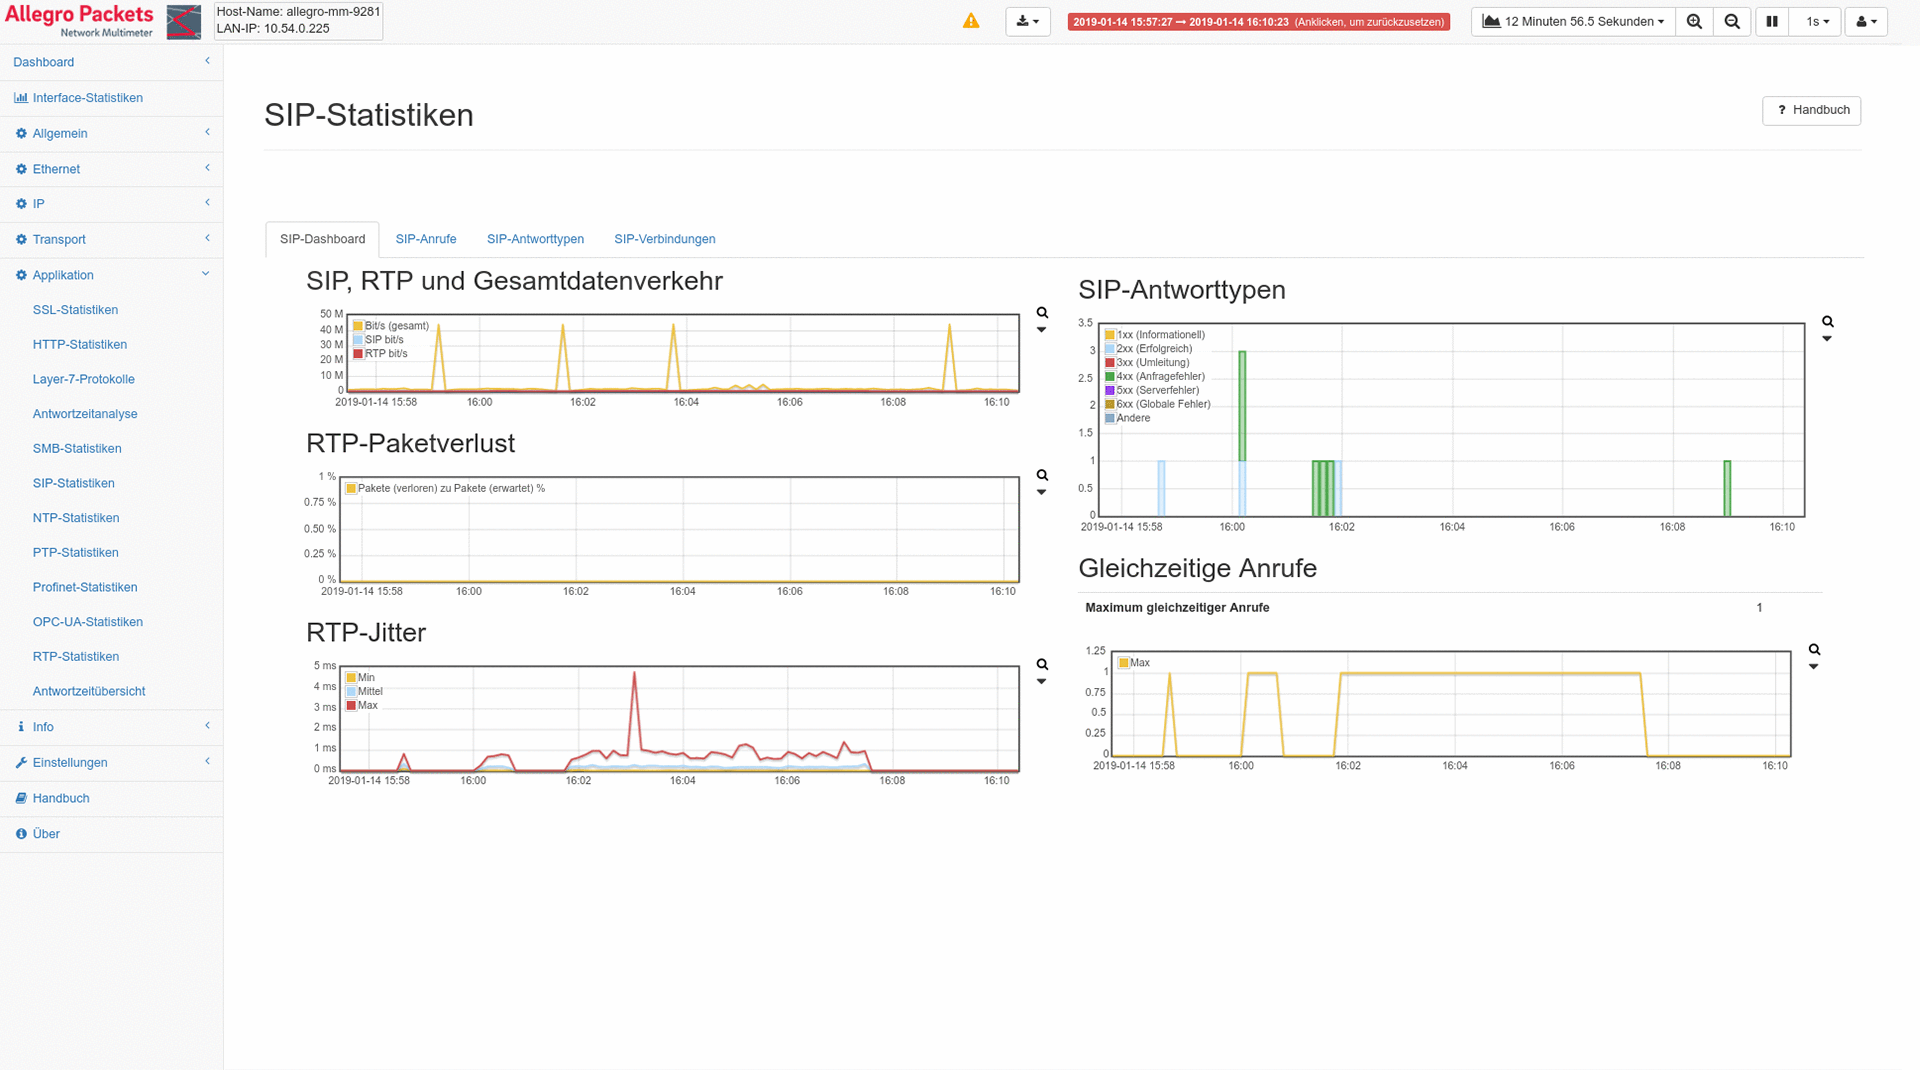
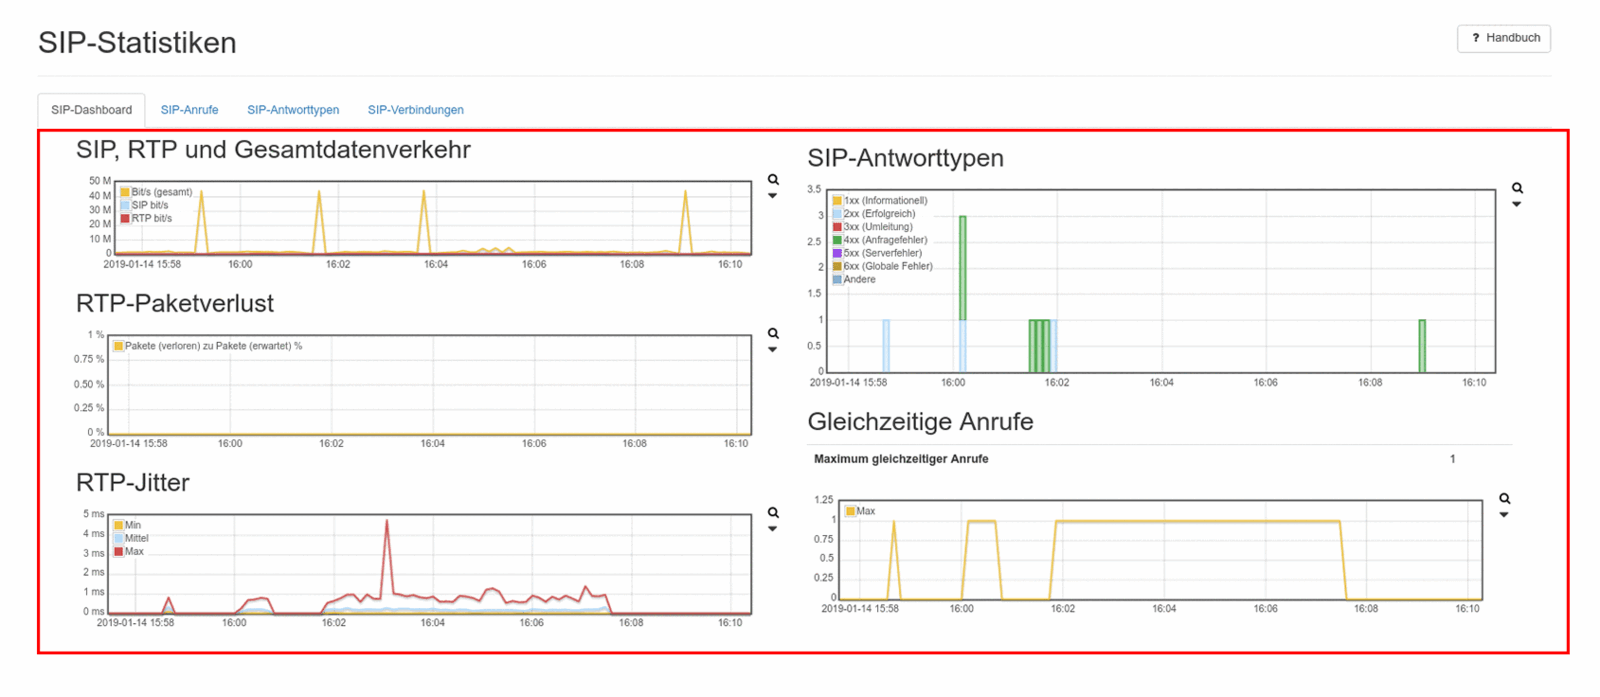
Global SIP Statistics

The Allegro Network Multimeter displays all significant quality metrics such as packet loss and jitter globally. In addition, it displays all successful and unsuccessful SIP calls according to error code via a graph and allows SIP errors to be narrowed down to a single point in time. In addition, all simultaneous telephone calls are displayed, e.g. to detect an overload caused by too many simultaneous telephone calls.


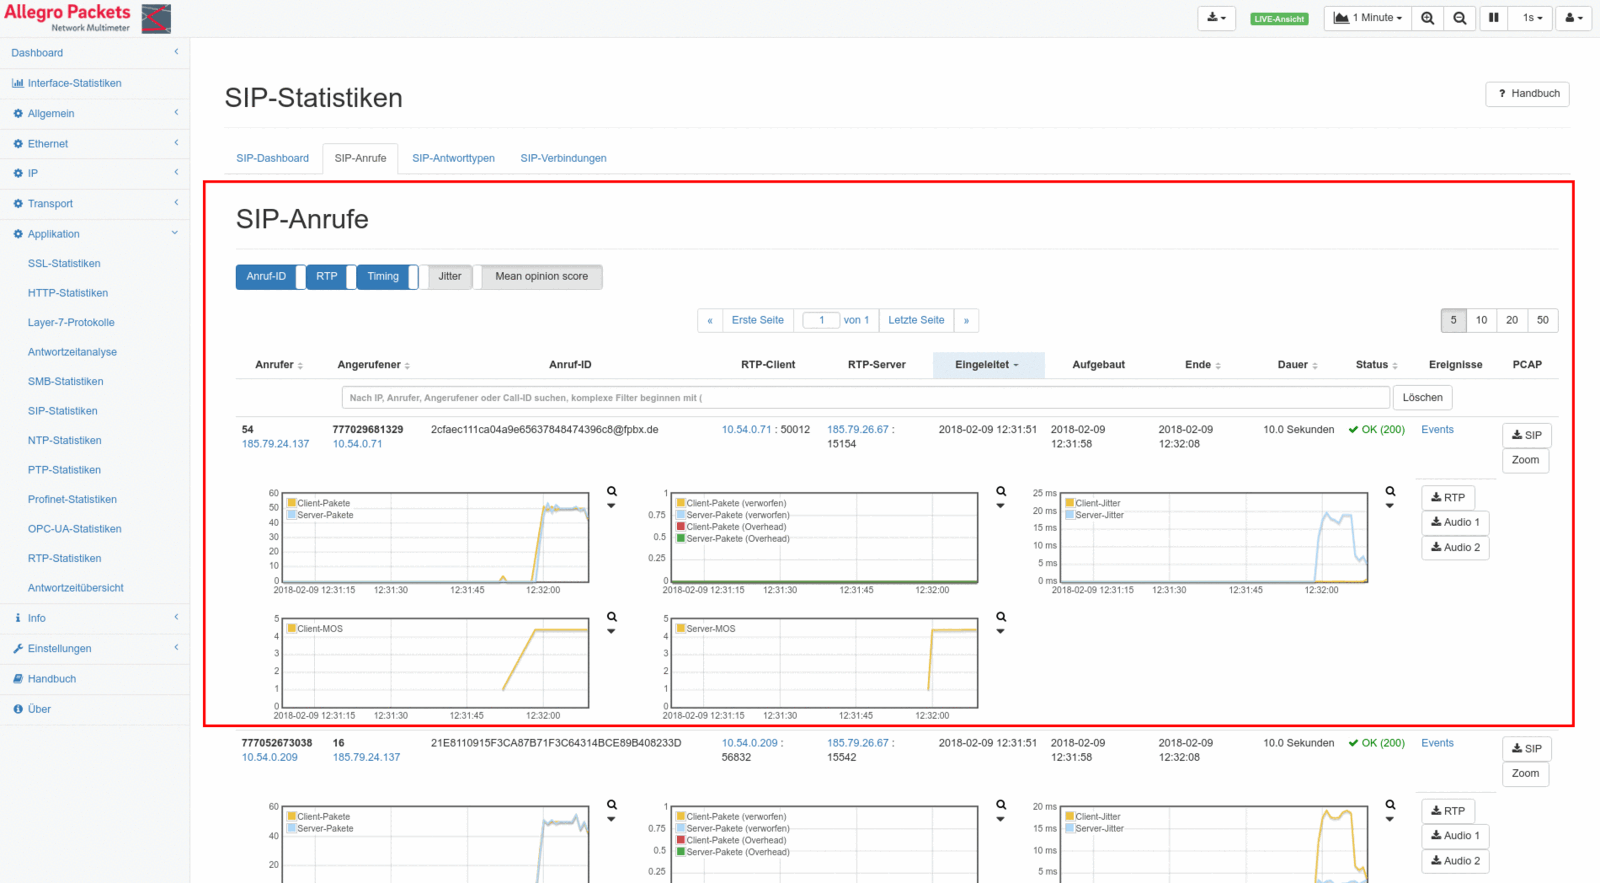
SIP Calls

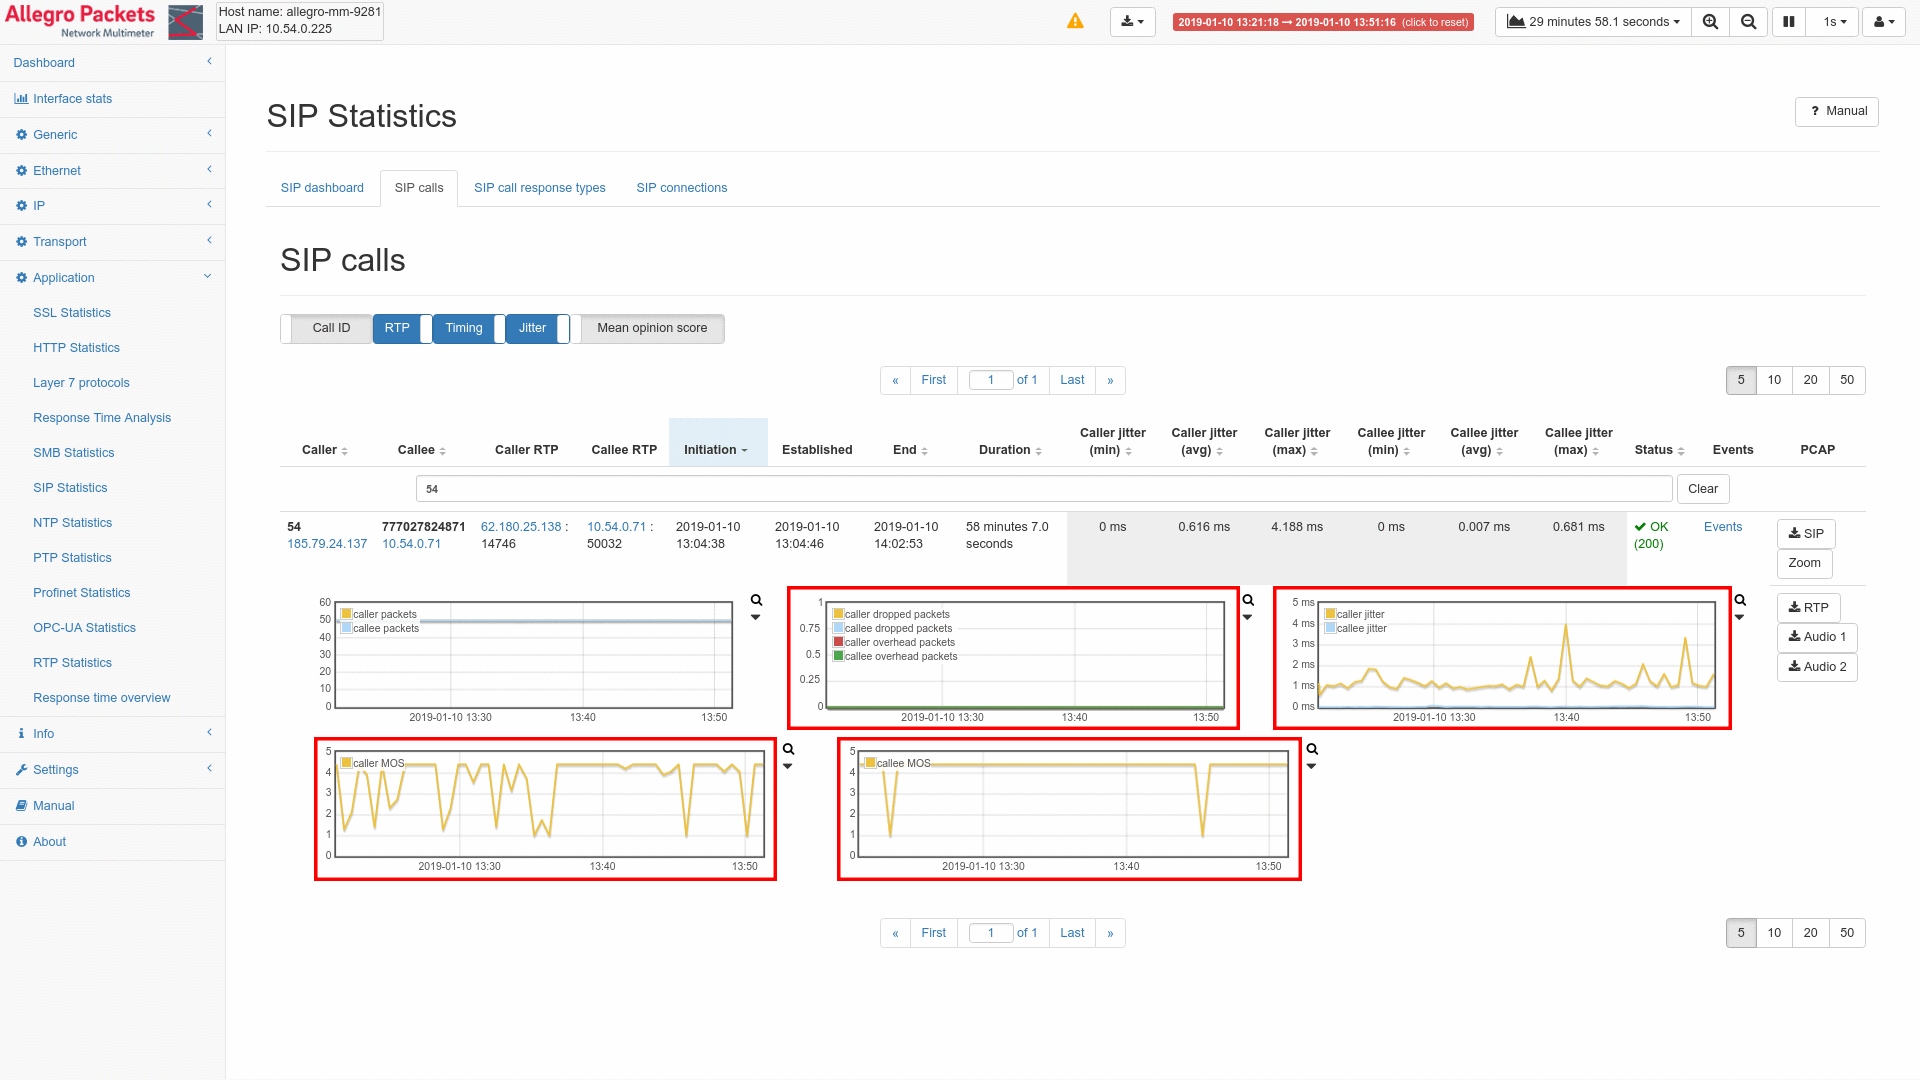
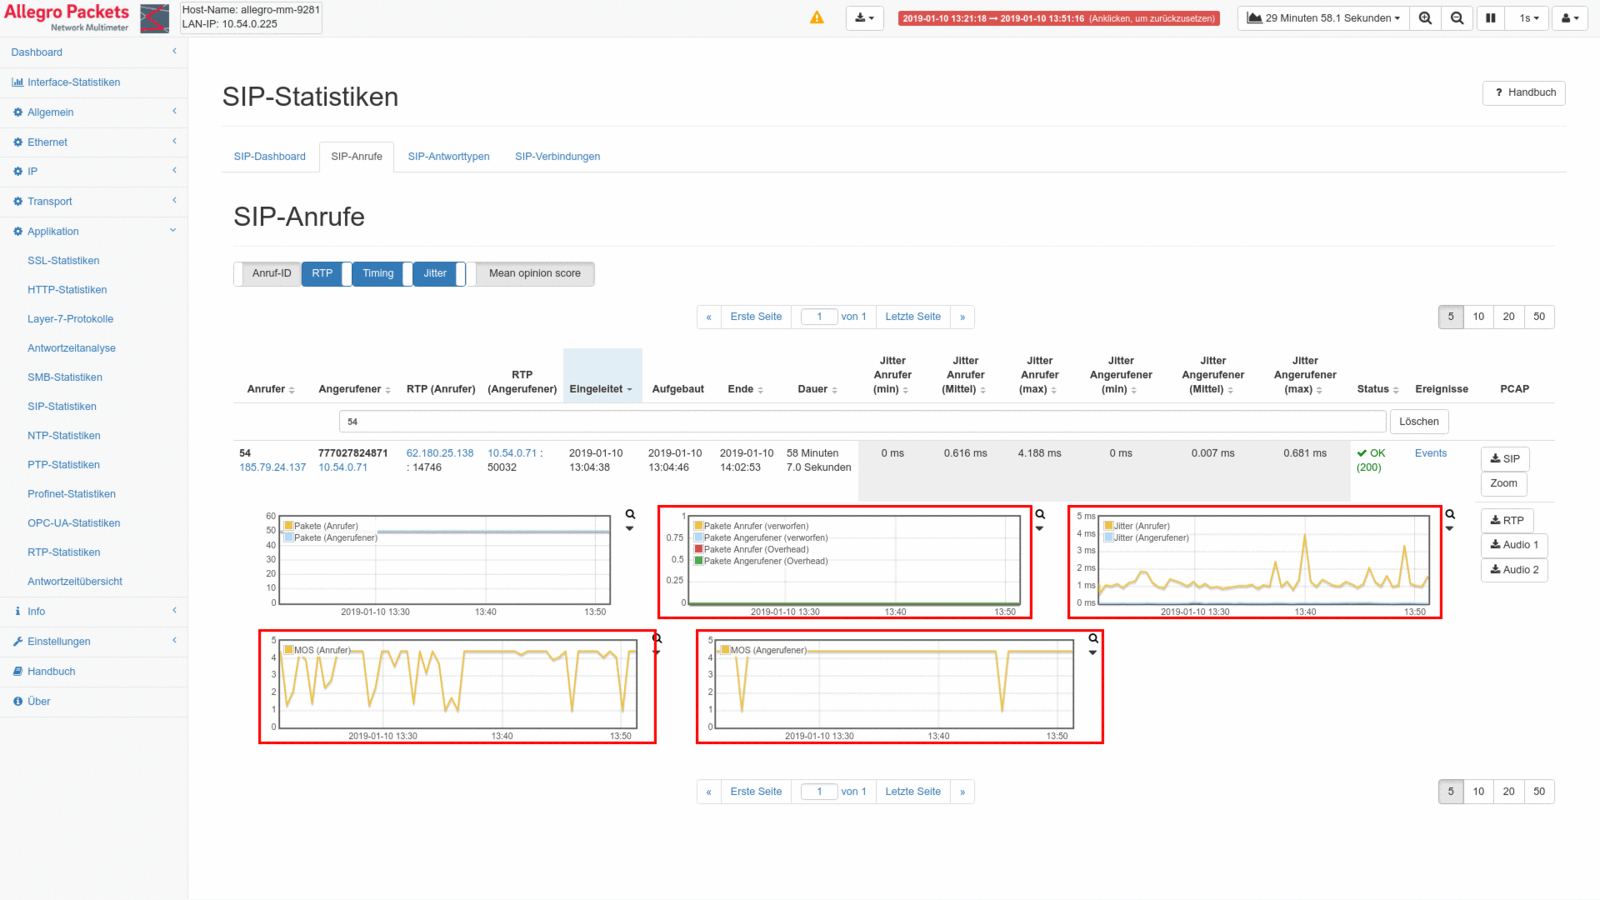
All SIP calls are clearly displayed in a table. All calls can be easily sorted and filtered according to call IDs, phone numbers, IP addresses, call IDs and jitter or MOS values. The SIP recognition automatically correlates the RTP connection belonging to the SIP call and displays this graphically with packet rate, packet loss, MOS value and jitter. The SIP and RTP connections can be extracted as a pcap.


Analysis of SIP and RTP Connections

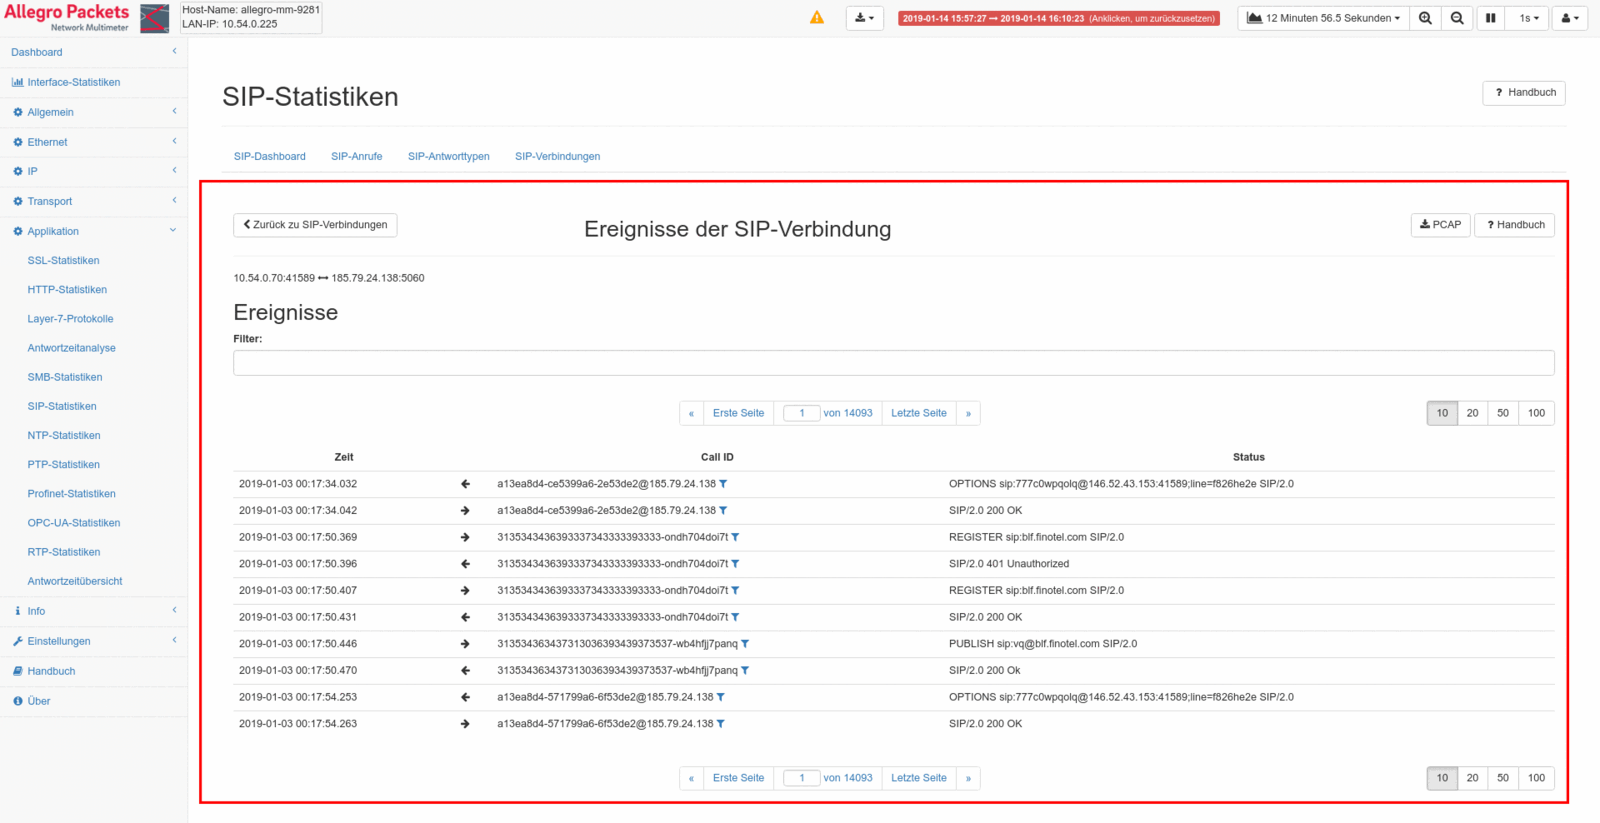
The Allegro Network Multimeter has integrated analysis for both SIP and correlated RTP connections. This allows the exact sequence of server communication to be tracked in real-time, even during individual SIP calls. For example, it is possible to check whether the authentication was carried out on the SIP server and was successful.


Analysis of Poor Speech Qualities

A classic application is a telephone call a few minutes or hours ago which exhibited poor voice quality. The Allegro Network Multimeter can extract this call from millions of others by real-time search and display the packet loss, jitter and MOS value of the RTP connection. If all these values are correct, the audio stream can be examined to see whether the source of the error is not outside the SIP system and, for example, there is already noise, crackling or an insufficient RTP level.


Alerting for Certain Network Events


Alarms for Fluctuating Values

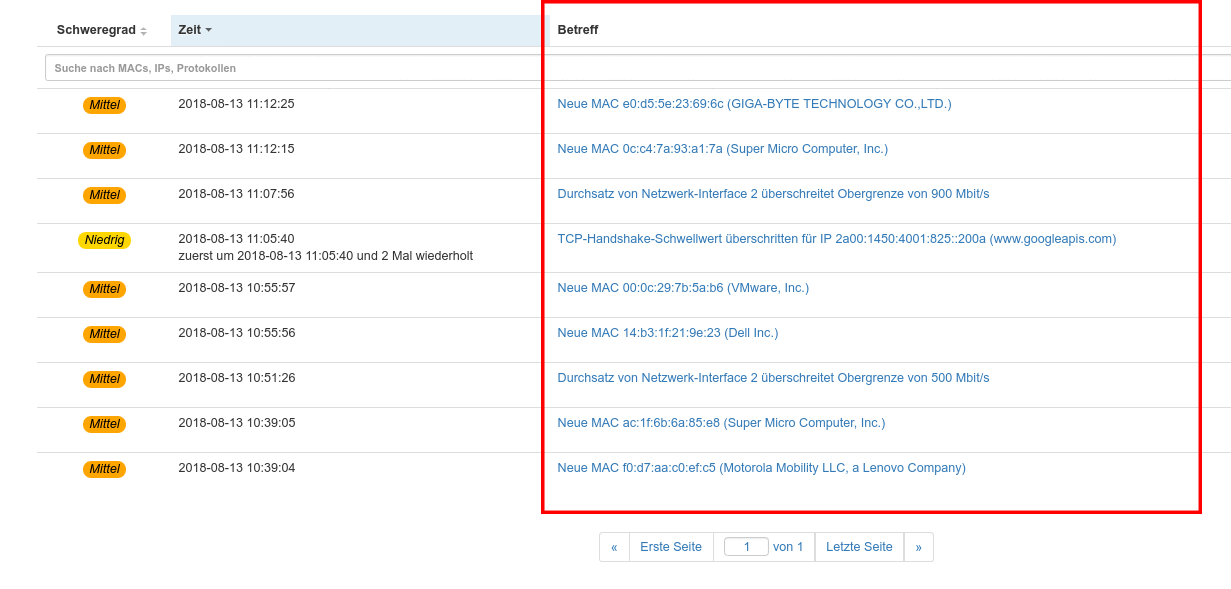
How many DNS queries took longer than a second? Which local HTTP server no longer responds? These events (and many more) are automatically analyzed by the Allegro Network Multimeter and detailed warnings are sent by email on request.


Frequent Network Problems

The Allegro Network Multimeter provides a number of quality parameters that can be individually activated for the network error message function. When the device is shipped, network error messages are deactivated with a few exceptions, since each network is configured differently. A sudden occurrence of additional loads is a problem only in some networks. This feature prevents irrelevant error messages from leading to false alarms.

Configure Error Messages

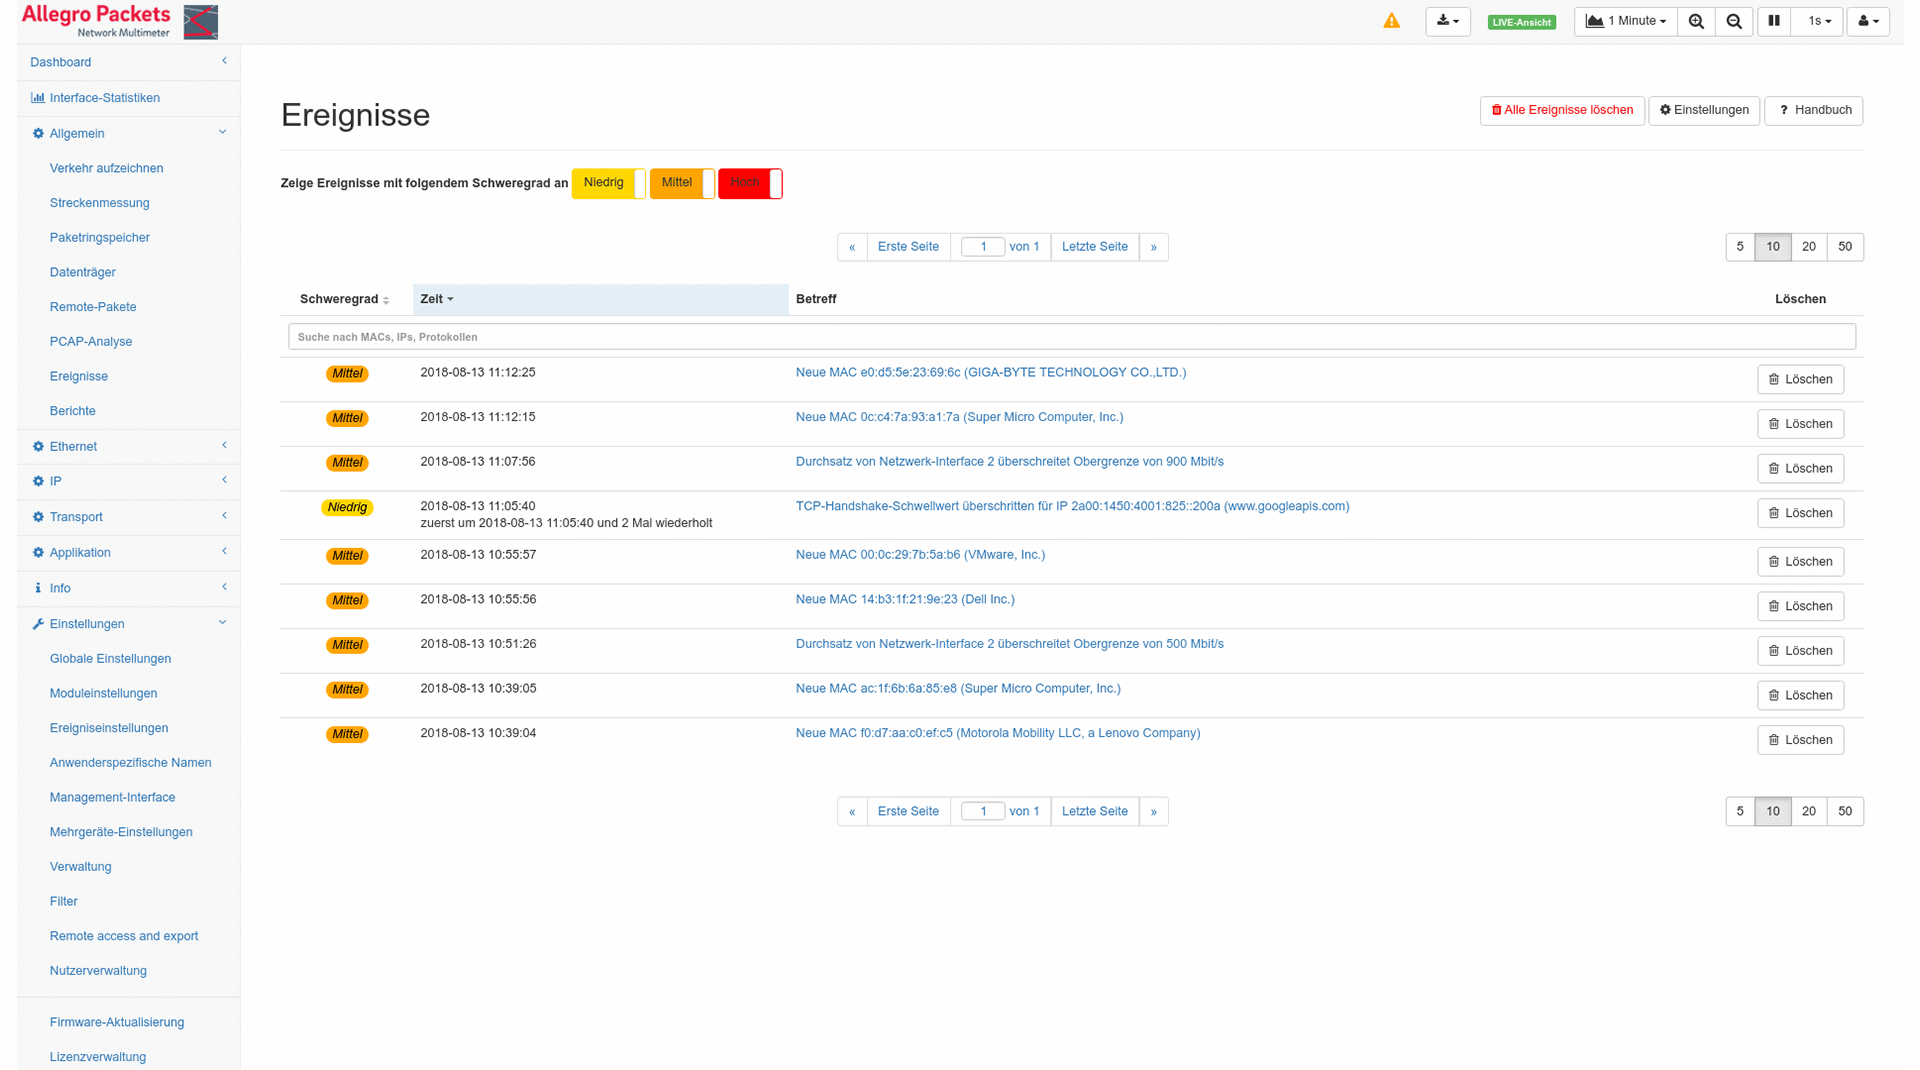
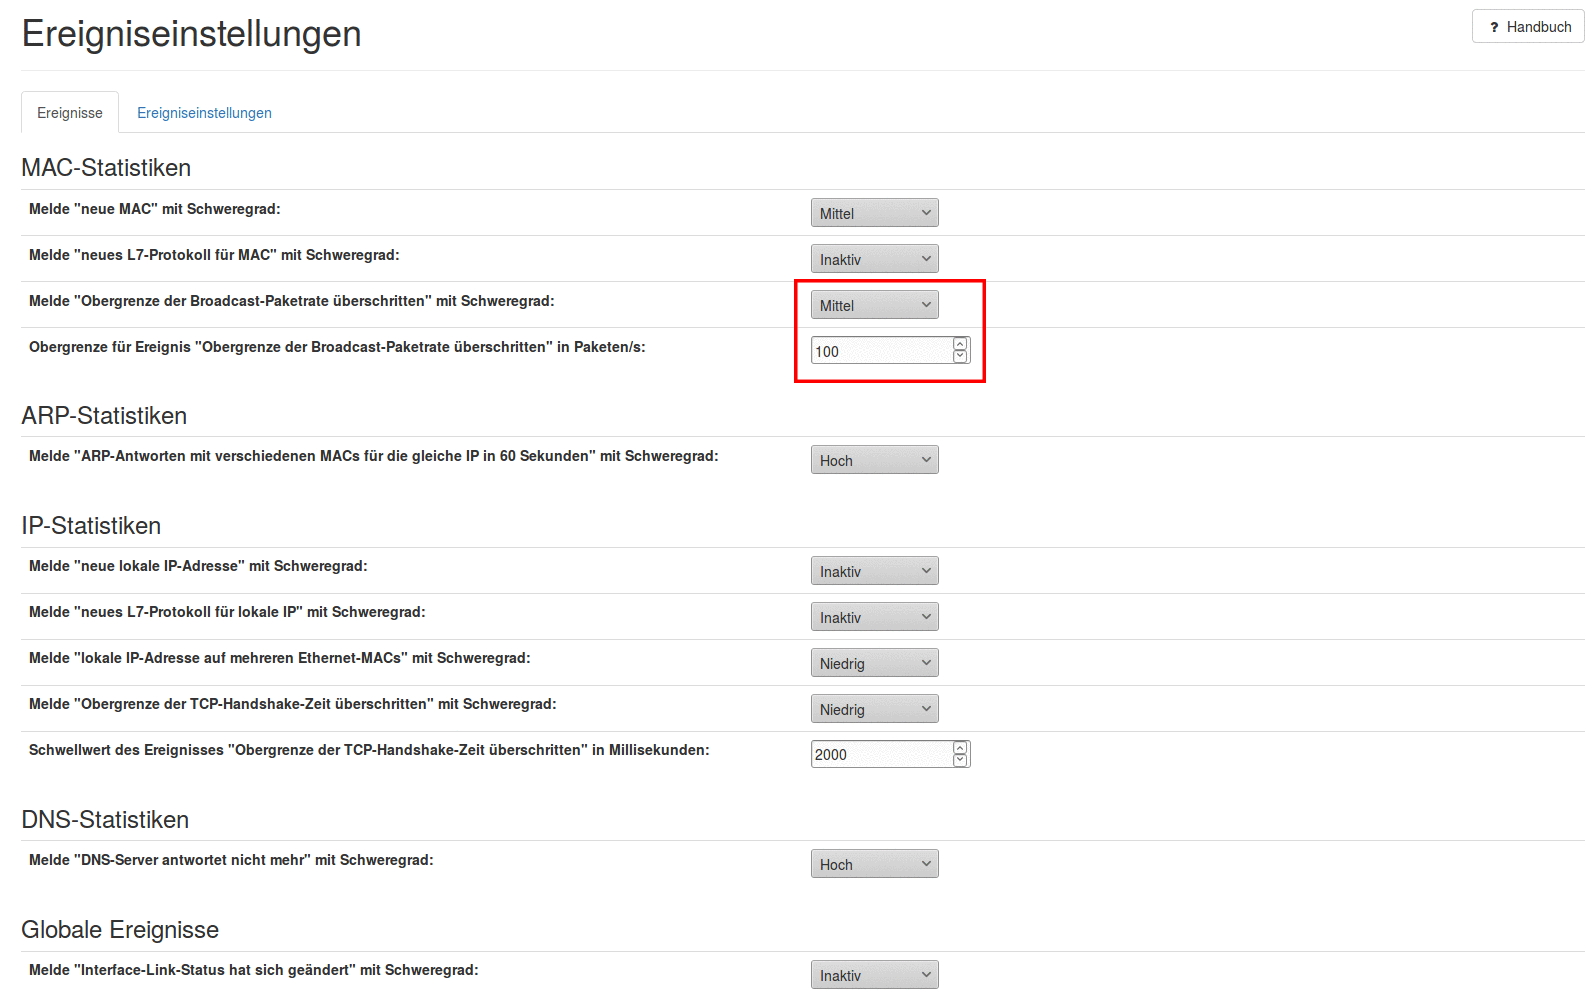
In order to activate further network error message alarms, the ‘Event settings’ section can be opened via the web interface. The information used for alerting is sorted by categories (e.g. MAC statistics, throughput or network layers) and the administrator can individually select the respective events. After a specific event has been identified in a network and the user has been informed by email, the events are displayed in the ‘Events’ statistics section. In addition to special network error criteria, various severity levels can also be set. The event ‘Broadcast Packet Rate’ is selected here in the figure. If desired, you can receive an email if the number of broadcast packets exceeds the set limit.


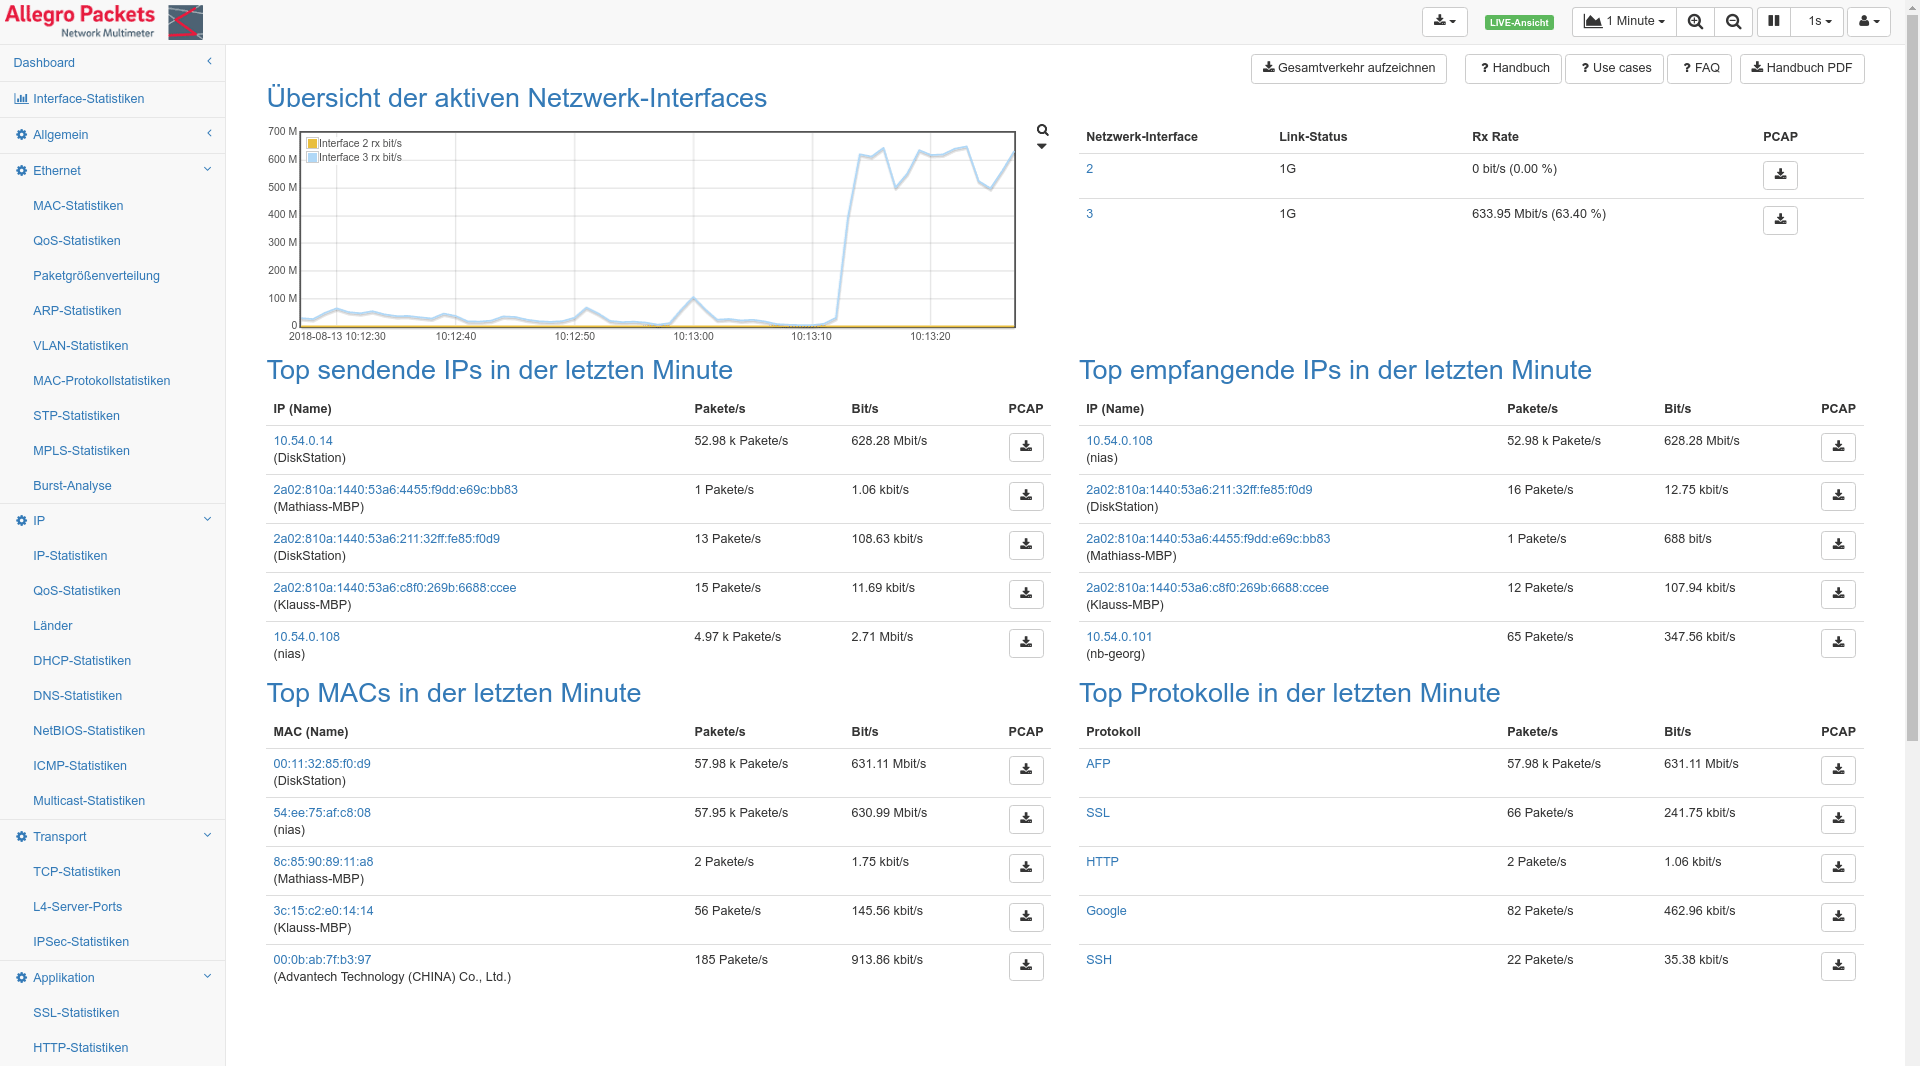
Dashboard with all Important Network Traffic Parameters

Intuitive Web Interface

The intuitive web interface, which works with any browser, allows an easy entry for network traffic analysis for fast troubleshooting. The integrated search function facilitates the sorting, searching and filtering of MAC or IP addresses, ports, VLANs, TCP handshakes, packet losses, HTTP latencies and much more. The results are displayed in fractions of a second. Even remote analysis without waiting times is possible.


Comprehensive Analyses

The Allegro Network Multimeter includes many different analysis modules. The Allegro Network Multimeter analyzes and correlates all metadata across network layers 2 to 7 and enables detailed monitoring of the entire network traffic. For example, all Ethernet types can be examined and extracted on layer 2. The analysis modules are constantly being expanded by Allegro Packets.


Real-time Analysis

The troubleshooting tool enables real-time analysis of network traffic immediately after commissioning. Network traffic problems and unexpected connection interruptions can be detected and mapped within seconds. The system administrator can quickly click through the statistics without waiting for the results. No time is lost waiting for the data and the work process is not interrupted.


Pcap Extraction for Wireshark

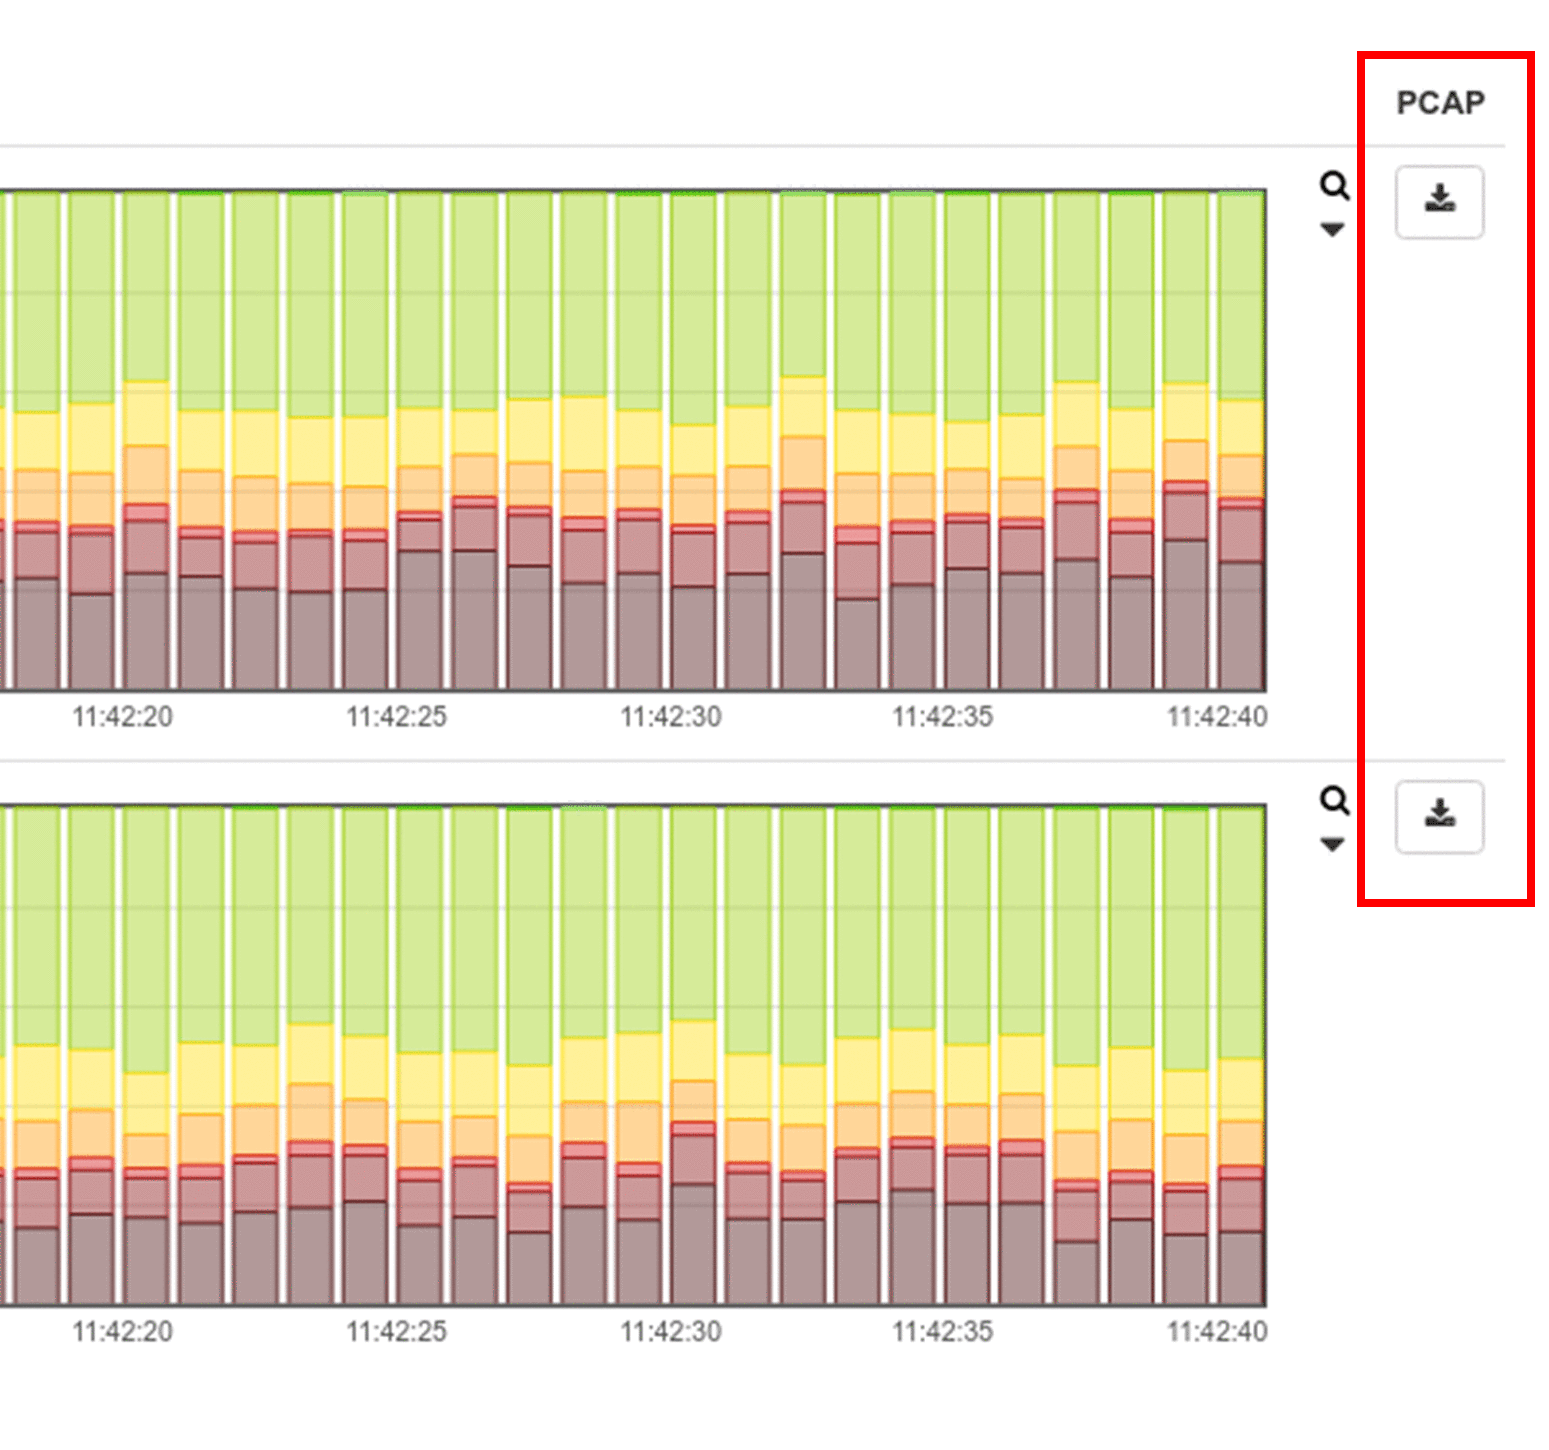
With the help of web interfaces, Pcap data can be extracted in real-time and retroactively: e.g. all packets of a MAC address, or all packets of a connection, or all packets of a layer 7 protocol at a specific time and much more. Wherever the Pcap capture button appears on the web interface, the data can be downloaded. This function is also possible retrospectively if the cause of the problem is already in the past. This feature eliminates the need for complicated filter settings. If you use Wireshark, the Allegro Network Multimeter is the perfect extension. It facilitates Wireshark analysis since only a fraction of the total traffic needs to be examined.