The PhyView Performance Test Report
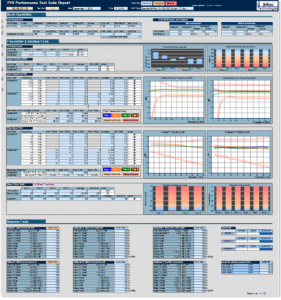
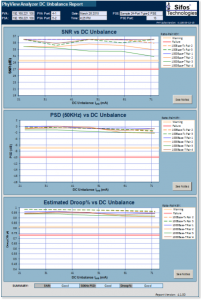
 The PhyView Performance Suite produces a Microsoft Excel spreadsheet report that adds graphical presentations of test results and colorized annotations of test limit excursions. Unlike a strict compliance test, many of the parameters captured by the PhyView Performance Suite are evaluated to “soft limits” that assess performance to generally fall into one of three bands: Green (or “Excellent”), Yellow (or “Acceptible”), and Red (or “Marginal”).
The report is structured such that each port tested creates a specific workbook tab dedicated to that particular port. Testing a 24 port switch would therefore cause a 24 tab workbook to automatically pop up upon completion of testing.
The report includes estimations for certain traditional IEEE 802.3 transmission parameters such as Peak-Peak Voltage, Rise/Fall Time, Droop, and Pulse Mask Fit on a per-pair basis. These estimations are derived from detailed correlation studies and analyses carried out by Sifos and other independent test labs.
For further information concerning correlations between PhyView Analyzer and IEEE 802.3 testing,
For those who must perform formal IEEE 802.3 physical compliance testing, PhyView Performance Reports provide an extremely efficient means to select worst-case (or best-case) performing ports to submit to intense testing.
![]() Open Sample Report (10/100/1000 Port – Rx Tests with Link Monitor)
Open Sample Report (10/100/1000 Port – Rx Tests with Link Monitor)
![]() Open Sample Report (10/100/1000 Port – Rx Tests with Packet Flow)
Open Sample Report (10/100/1000 Port – Rx Tests with Packet Flow)


