Netzwerkanalyse_Allegro200

Use Cases

The Allegro Network Multimeter is a powerful real-time network multimeter for detecting network problems. It measures many performance parameters from Layer 2 to Layer 7 and is used for troubleshooting and network analysis.


The Allegro Network Multimeter uses an in-memory database to store the metadata of the processed packets. This means that all recorded measurement data is available without time-consuming disk access and can be called up for instant searches.

The Allegro Multimeter can operate without an internal or external hard disk and only use in-memory for the metadata, i.e. no data is written to the hard disk.

The in-memory database capacity varies between 2 GB and 1.5 TB depending on the model. As an approximation, the history of about 150,000 connections and their aggregations can be stored per gigabyte in-memory database.

The Allegro Network Multimeter adapts its memory configuration to the quantity of traffic. It always stores all data. If the memory is full, the longest inactive connections and IP addresses are deleted. This means that in smaller networks the device stores historical data for a longer period, while in larger networks the device stores more IP addresses and associated information, but only for a shorter period of time.

The Allegro system’s memory fills up automatically over time (except for a memory reserve) to provide measurement data for as long as possible. Afterwards, old data is automatically deleted to ensure optimal system memory.

Ring Buffer

If a packet ring buffer is used, the packets are stored on a connected storage medium. The following systems can be used for this purpose:

  • Internal hard disks or SSDs (Allegro 500 and higher),
  • External hard disks via USB3 (all Allegro Multimeters),
  • iSCSI systems via the management port (all Allegro Multimeters).

The ring buffer makes it possible to create a fixed size packet buffer on which all recorded packets are stored – on one or more external storage devices. When the buffer is full, the oldest packets in the buffer are replaced by new packets.

The ring buffer can also be created over several hard disks. Up to 64 hard disks with a ring buffer of several petabytes are supported. Additionally, a data redundancy with 0 up to 3-fold redundancy is supported.

To prevent misuse, the storage device can be formatted with AES256 encryption (Caution: subsequent access to the disk without a password is not possible).

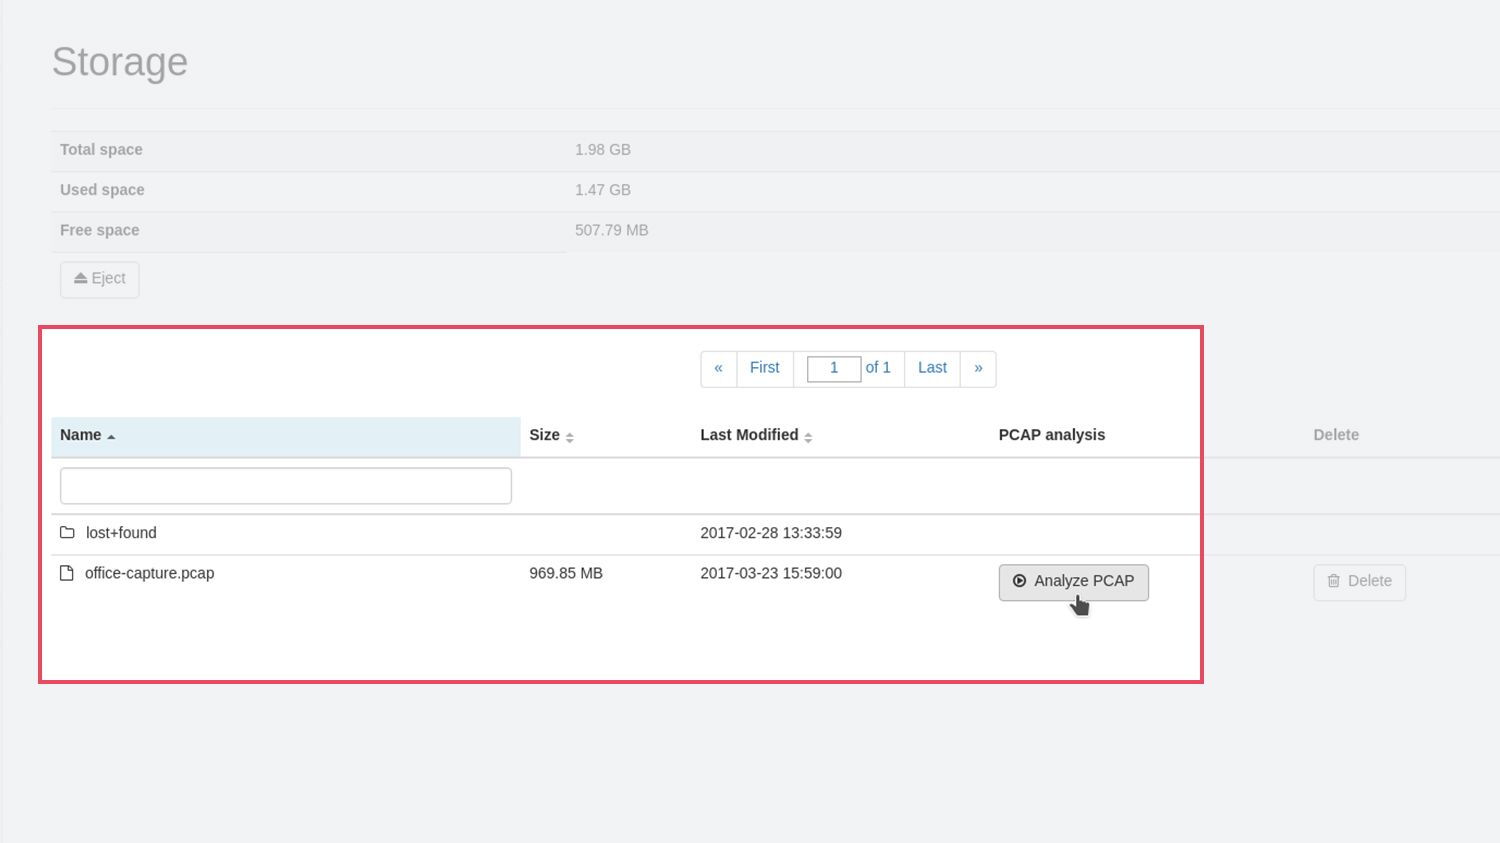
By using the packet ring buffer on the Allegro Network Multimeter hard disk, it is possible to extract traffic from the past and create a pcap from it. The packet ring buffer can be set up on both internal and external storage devices. When the Allegro Network Multimeter is shipped with a storage device, the ring buffer is preconfigured and uses 75 % of the available capacity. Otherwise, the ring buffer can be created directly on a formatted storage device on the corresponding page in the Web interface.

The »packet ring buffer« statistics page displays information about the use of the ring buffer and multiple graphs of the stored traffic (Figure 2). Filters can be used to set which packets are stored in the ring buffer. By default, all packets are stored.

The capture function accesses the contents of the ring buffer and can extract data traffic from the past. On every page on the Web interface there are pcap symbols. Click on the pcap icon next to the statistic whose packets you wish to extract.
 

This use case demonstrates how a sales representative’s sudden problem with a WebEx session is solved. Here, the Allegro Network Multimeter shows the IT staff L7 protocol and link statistics so they can locate the error, leading to a fast solution of the problem.


In heterogeneous networks it is often difficult to determine the IP address of a terminal device. This video explains how the Allegro Network Multimeter helps you to find out the IPv4 or IPv6 address of a terminal device within seconds. Different ways to determine the IP are shown, e.g. via the MAC address, the device manufacturer or the DHCP name.

Improve the network by proactively monitoring performance

An important part of an administrator’s work is to monitor the various components for the performance, traffic usage and protocols of a network and the services it provides. With the Allegro Network Multimeter, there is no need for lengthy configuration; instead, network analysis can be performed directly live in real time and even with the smallest appliance (Multimeter 200).

Suppose you are asked for a report or status assessment of what network changes have occurred recently, e.g. the average/maximum load or quality of internal servers. You can quickly and easily get the information you need using the Allegro Network Multimeter, such as setting up faster network connections or using other switches. The multimeter appliance provides a quick overview of a before-after comparison, the network users and the protocols used as well as detailed statistics of the individual server services (SMB, HTTP, SSL, etc). The data for long-term evaluation of the network from the week before last, last week or the current week can be collected in real time and stored for archiving or further processing.


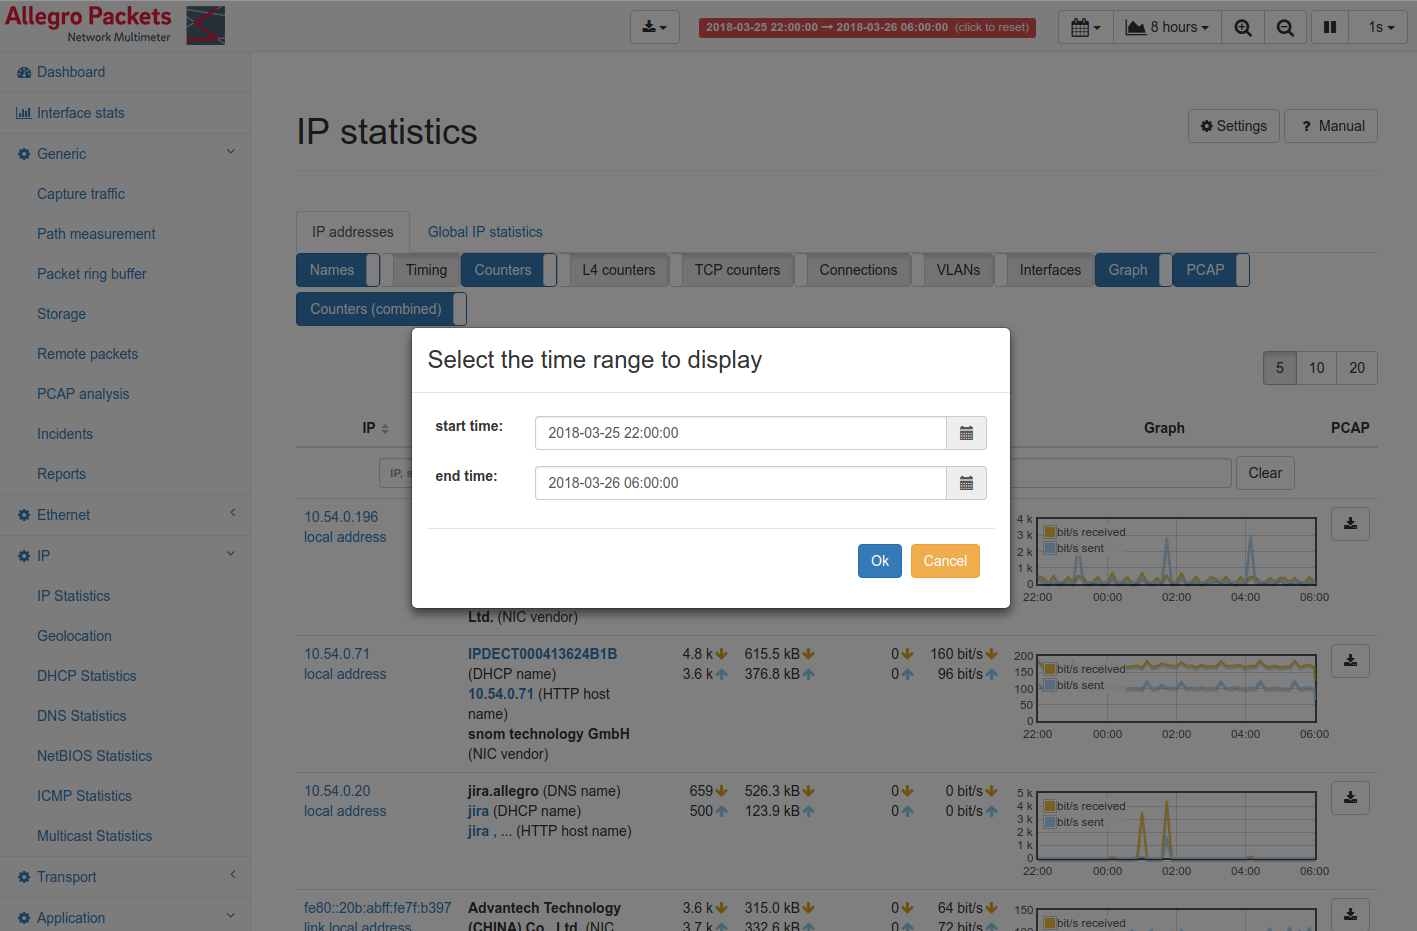
Ideally, problems or malfunctions can be rectified before they are noticed by users and can be clearly presented in daily or weekly reports. If irregularities occur, you can react immediately. The Allegro Network Multimeter makes it easy to analyse network traffic after the event. Such data also often contain the best indications of systematic availability problems. You can define any time ranges, e.g. between 22:00-06:00, in order to limit the causal error within minutes and then take measures to correct the error.

In live operation, an overview of IP addresses is displayed, sorted by the IPs with the most packets during the last minute. If a time range is selected, the IPs with the most packets are listed in this interval. Individual IPs can be clicked to access the IP detail statistics for that IP, or the Top IPs link can be clicked to access the main IP module.


What factors can the Allegro Network Multimeter network monitoring tool detect?

Network monitoring with the Allegro Network Multimeter tool can capture many factors and parameters of a network, such as the utilization of network components or lines.  These include the status of lines and virtual links, the topography and routing in the network as well as the transmission properties for individual protocols such as HTTP, FTP, DNS, SIP and TCP. In addition, there are transmission times, delays or error rates. Alarms and status messages from network components and devices connected to the network complete the collected information.

The Allegro Network Multimeter can be used to detect faulty components or data transmission problems. In the event of an error or failure of network components, operators or administrators are informed by alarm. Measurements of round-trip delays, data rates and end-to-end transmission times are also essential functions of network monitoring. They ensure that the quality to be provided by the network is maintained.


How the Allegro Network Multimeter can help you solve network problems

Here’s a situation familiar to every system administrator. An employee tells you that they can’t always use some of the services in the network. However, they can’t give you any specific data, such as the exact time at which they couldn’t access which service or whether the same server connection was always concerned.

How can you tackle this problem? By using the Allegro Network Multimeter, you can narrow down the cause of the malfunction within a matter of minutes and then take measures to correct it.

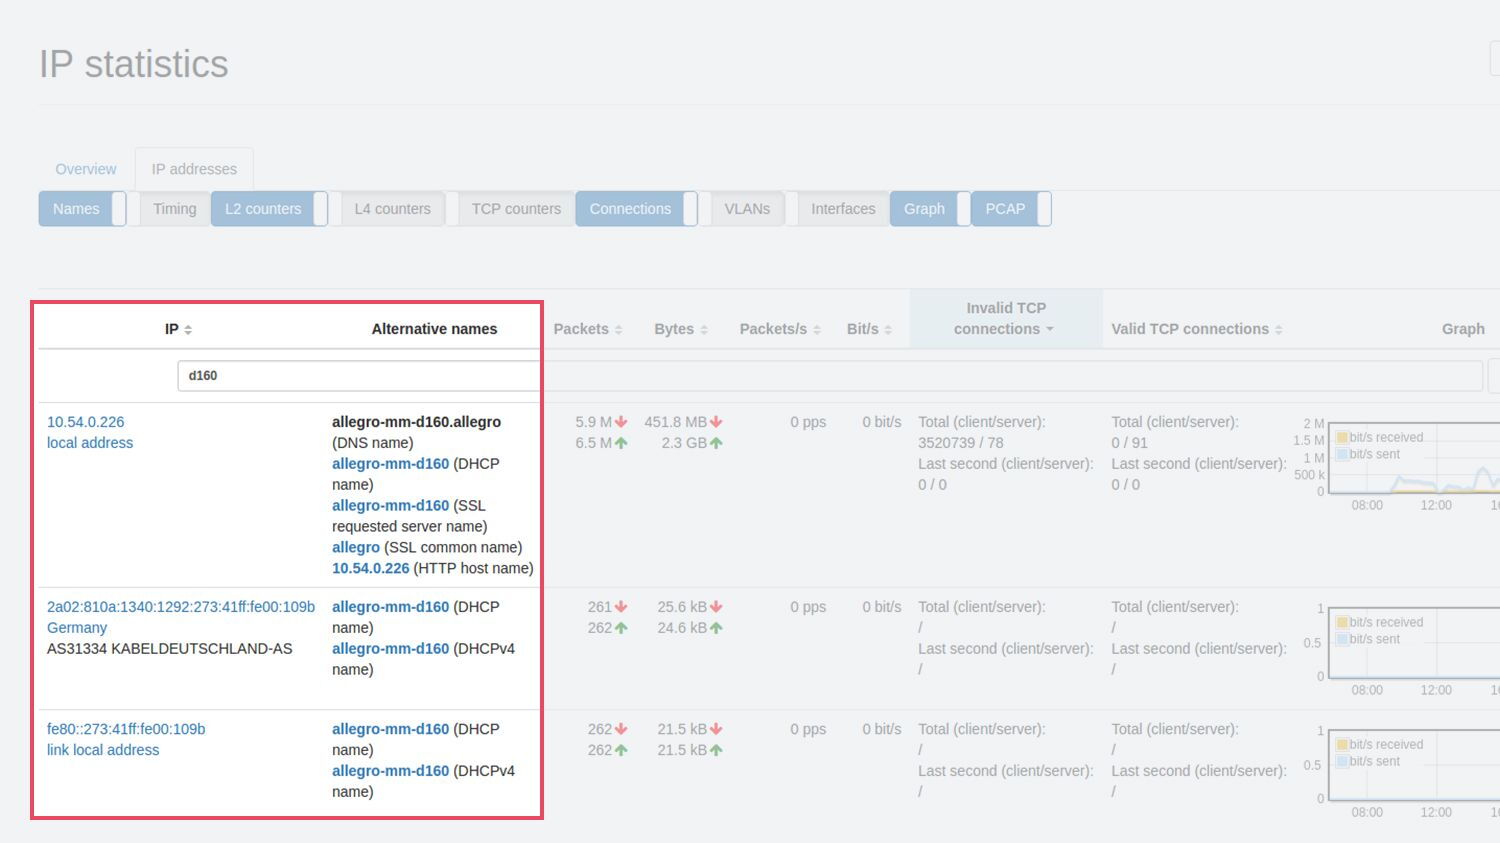
First search for the user via the browser-independent web interface. This is done intuitively by entering the user’s name into the full-text search in the IP address list within the central IP section. Matching computers are immediately displayed.


Click to select the computer of the employee concerned. The detailed view which now opens contains plenty of information broken down into different tabs. Go to the overview page and inspect the faulty server connections.

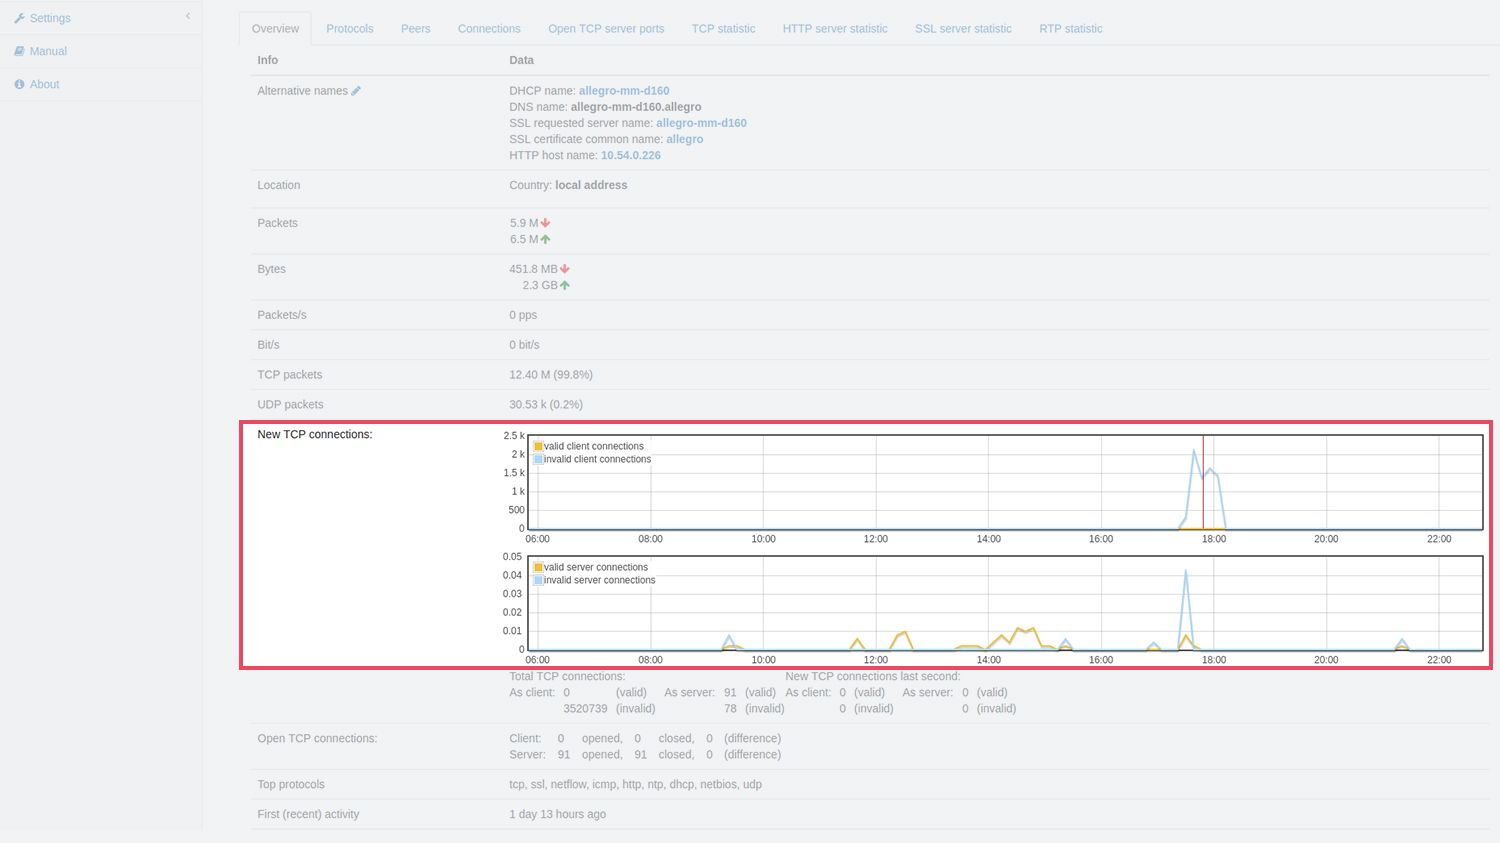
These ‘invalid connections’ are shown in blue in the graph ‘New TCP connections’. By default, the current server connections are displayed. If you zoom out, the time interval expands to show the past few hours. An especially large number of faulty server connections occurring at certain times are immediately apparent.


Pinpointing faulty server connections

To examine the untreated server connections more closely, clicking on a peak limits the time range to this time interval. Similarly, zooming in a few times enables a very short interval to be displayed.

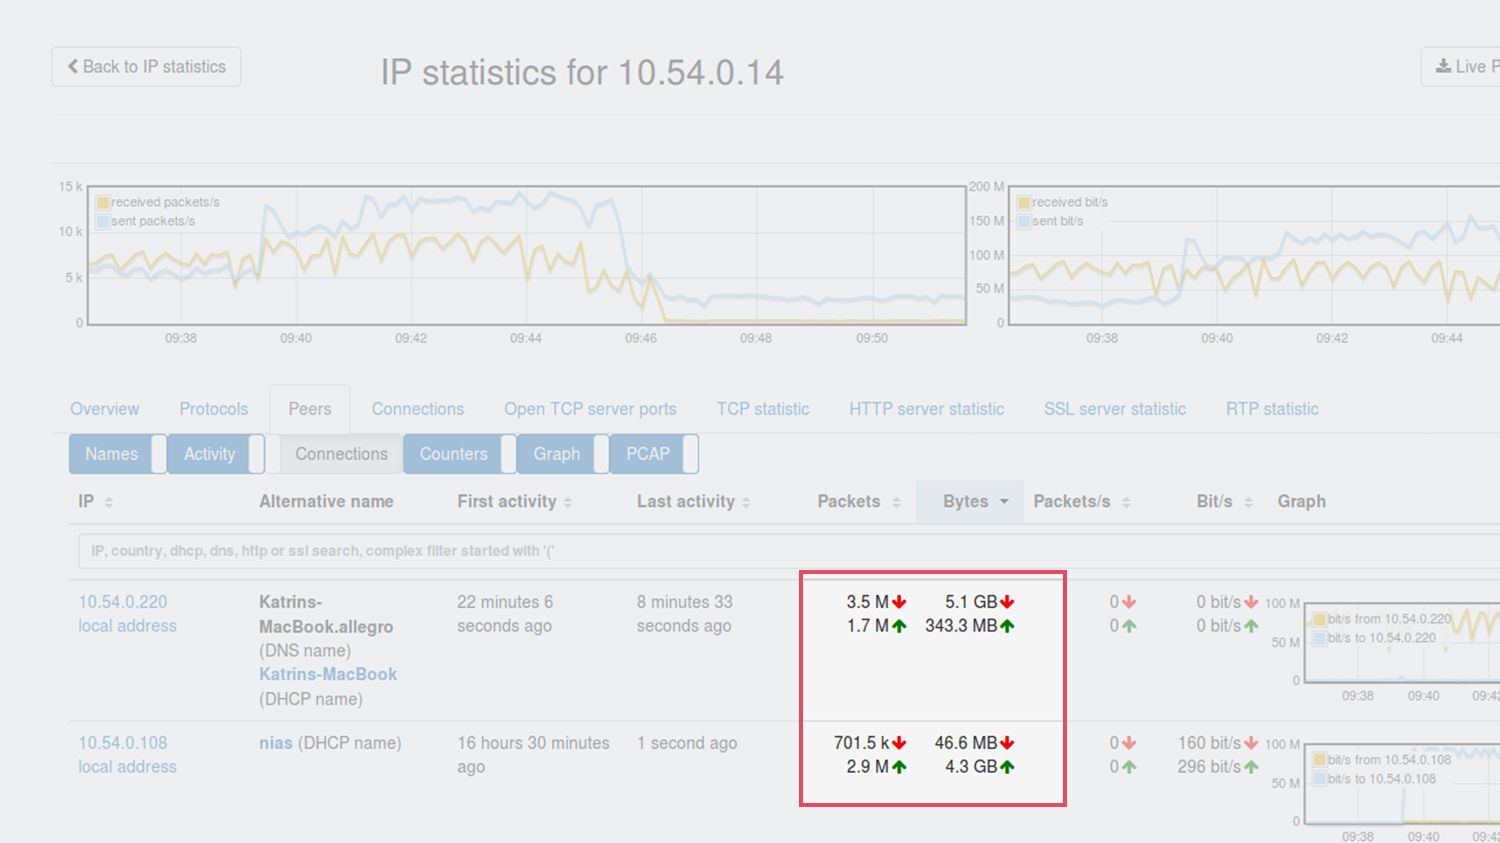
Switching to the ‘Peers’ tab now allows you to see the servers contacted in the time interval concerned. Sort them by ‘invalid connections’ again to immediately see the servers with the most errors (see screenshot). For a more detailed look at why server connections aren’t working, you can now create and download a pcap from the ‘packet buffer’ for the selected period and IP pair.

Hence, despite vague user information, you can still identify the affected server in a matter of seconds and examine the malfunction in detail using the isolated network traffic.


Analyzing bandwidth bottlenecks in the ‘SMB server’ section of the Allegro Network Multimeter

Suppose you’ve been asked to submit a report about what bandwidth the file server uses and which users had the highest traffic at a certain time of the day. The necessary information can be obtained quickly and easily using the Allegro Network Multimeter. The device provides a quick overview of all the SMB servers used, their users and the protocols used, as well as detailed statistics for each SMB server.

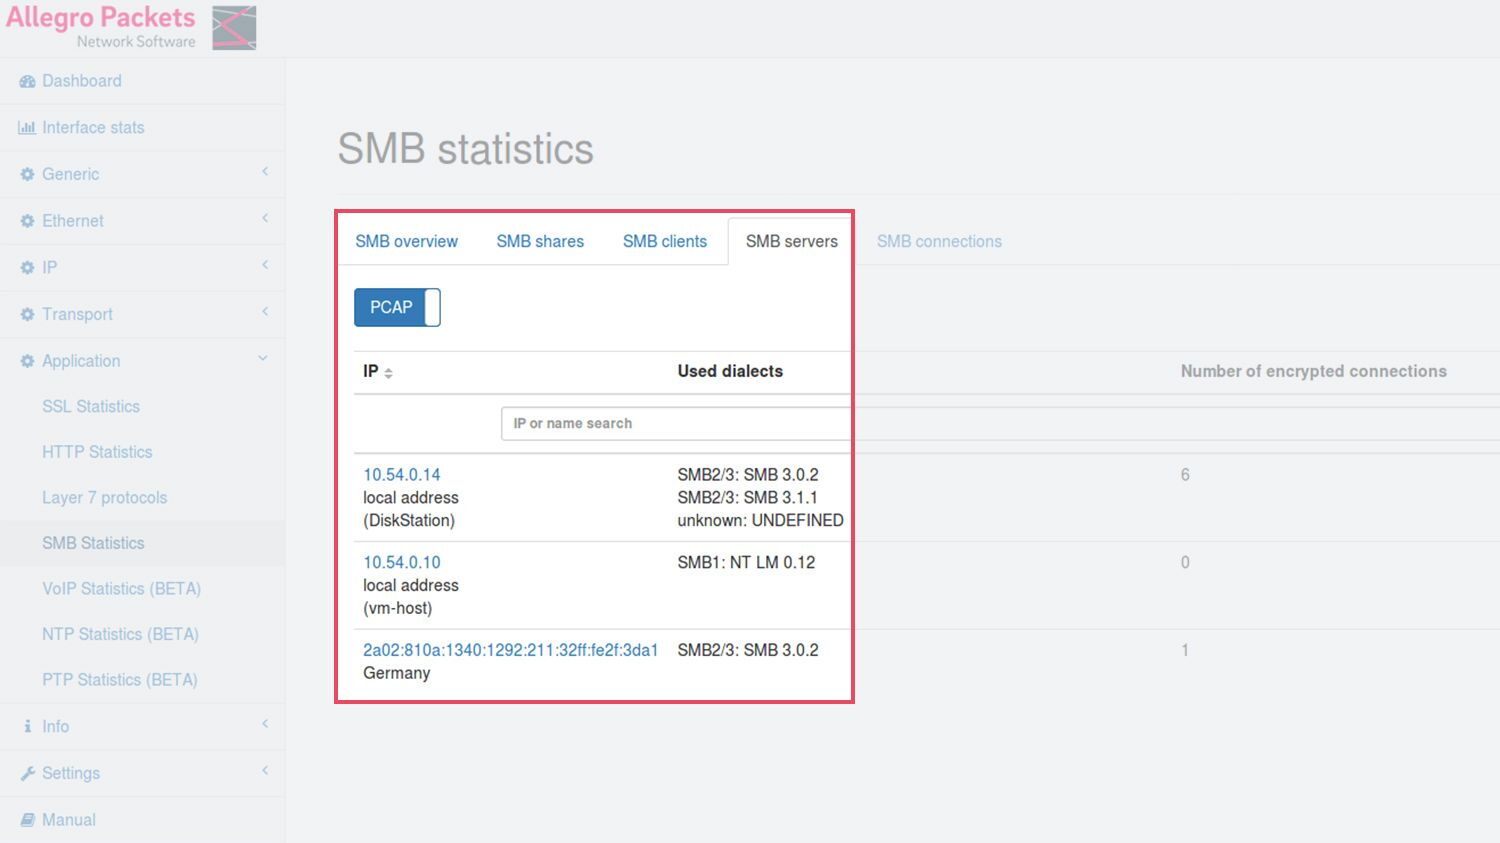
Open the web interface of the installed multimeter in your browser. First of all, the dashboard is displayed. To find the file server(s) in the network, select the item ‘Application à (SMB statistics)’ in the main menu.

You can navigate to the ‘SMB server’ tab from the overview that opens up summarizing information on the SMB statistics. All SMB servers detected in the network are listed here.


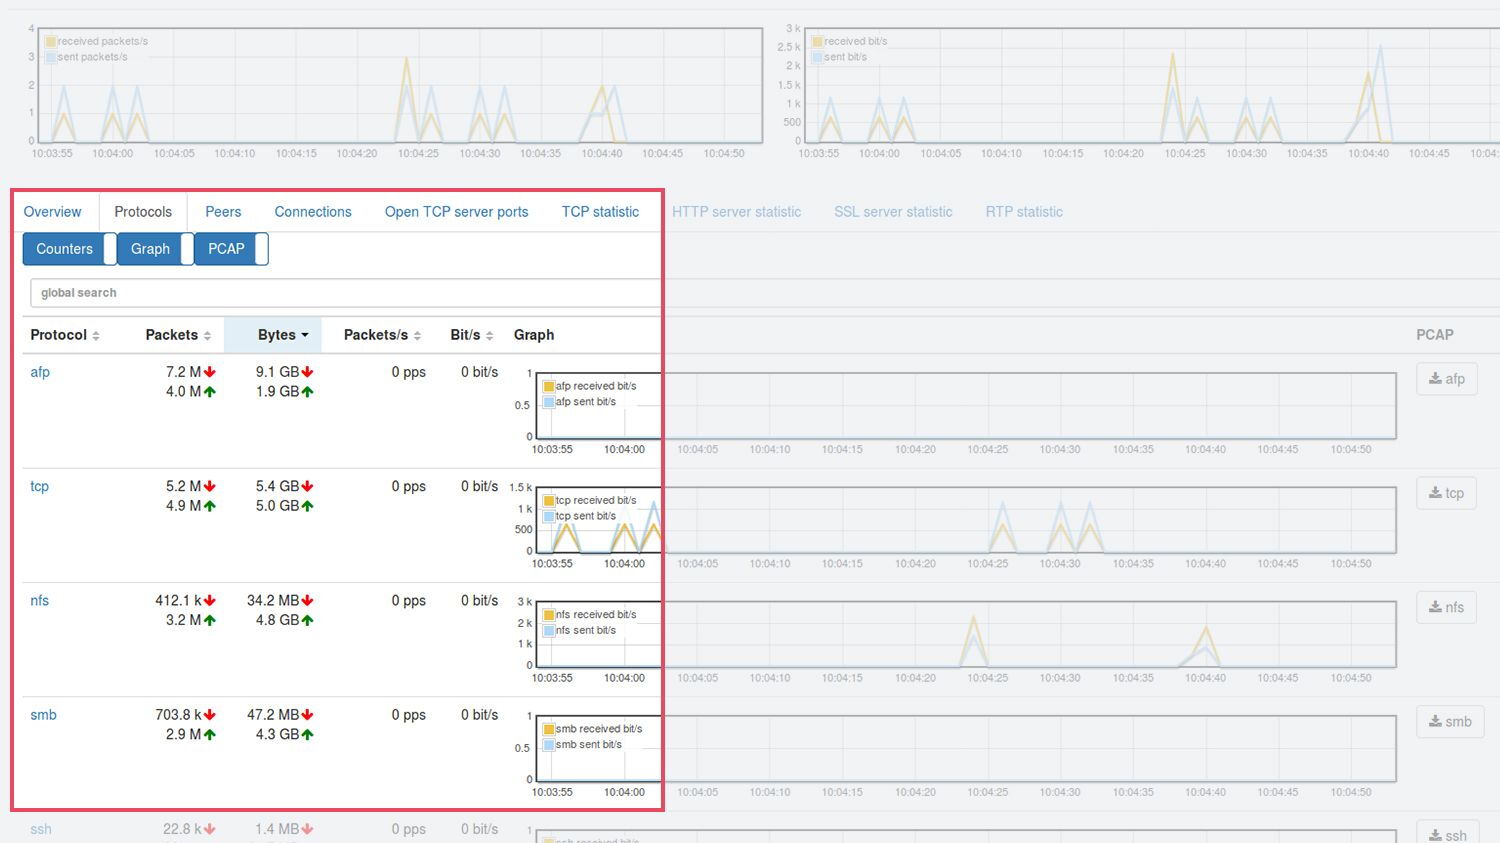
Click the IP address of the SMB server for which you require detailed information. The IP statistics are now displayed with the address name and the traffic. If you’re interested in finding out which protocols are currently in use, they can be seen in the ‘Protocols’ tab (see screenshot). The ‘Peers’ tab lists all users who accessed this SMB file server.


Detecting and debugging conspicuous accesses using the SMB statistics

If you want to analyze a certain period because network errors occurred at this time, select the required time interval in a graph by moving the mouse. This and all the other statistics pages will now refer to this period. In the dashboard under ‘Top IPs’, you can see that the highest traffic was caused by access to the file server. If you want to narrow down the problem (for example to ascertain whether the bulk of the traffic came from a certain user), click on the IP address of the file server and then the ‘Peers’ tab. You can see here which user connections to the SMB server used the highest bandwidth.

If you’re more interested in a higher-level pattern, you can choose a wider interval as required. Typically, the SMB server should have the most accesses at typical working times. If in such a period the traffic suddenly drops sharply or occurs at unusual times, this may indicate problems.

No matter the timeframe or whether it’s your own or an external network, malfunctions and bottlenecks on SMB servers can be easily detected and resolved with the Allegro Network Multimeter.


Using Allegro Network Multimeter to create a download of the diagnosis packet capture

It’s very easy to use the Allegro Network Multimeter to create a Packet Capture (pcap) of a network error. Apart from our multimeter, all you need is internal or external data storage. You can then activate the ‘Capture Buffer’ feature, which stores all your network traffic for a certain time. How many days you can look back in the past depends on your level of traffic. In our office, a 1.5TB hard drive allows us to look back 28 days.

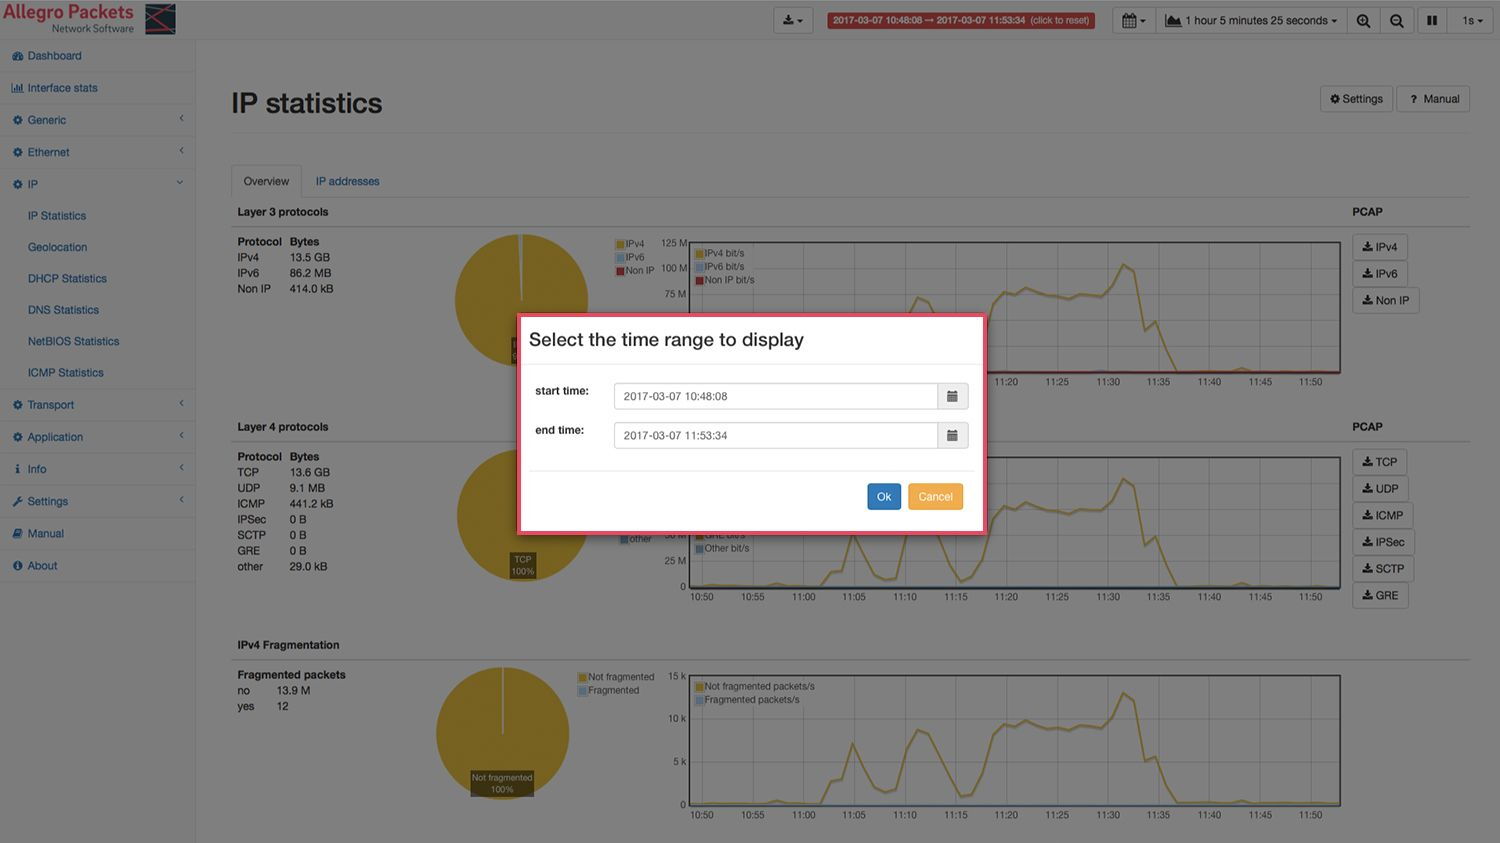
Once these requirements have been met, you can easily obtain a Packet Capture recording a past event. There are two ways to choose the time interval. You can select it by clicking on the network traffic history graph and ‘zooming’ to the desired time. Alternatively, choose from suggested intervals via the calendar symbol at the top of the user interface or set any interval you like using ‘Select Range’.


As soon as a time interval has been selected, the green ‘LIVE view’ display at the top of the user interface changes to show a time interval with a red background. Clicking on the time interval will take you back to the live view.

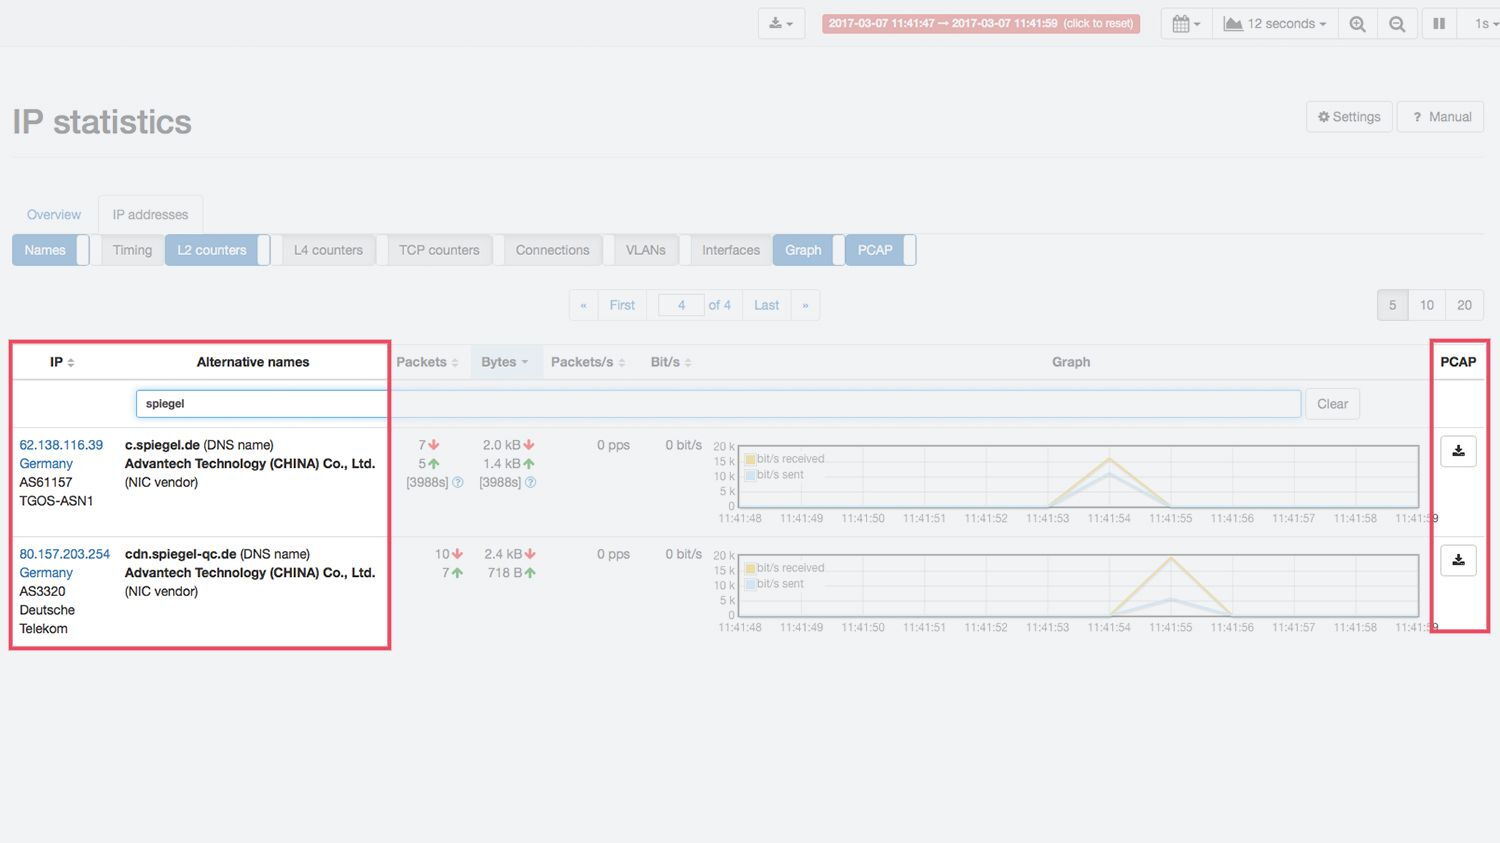
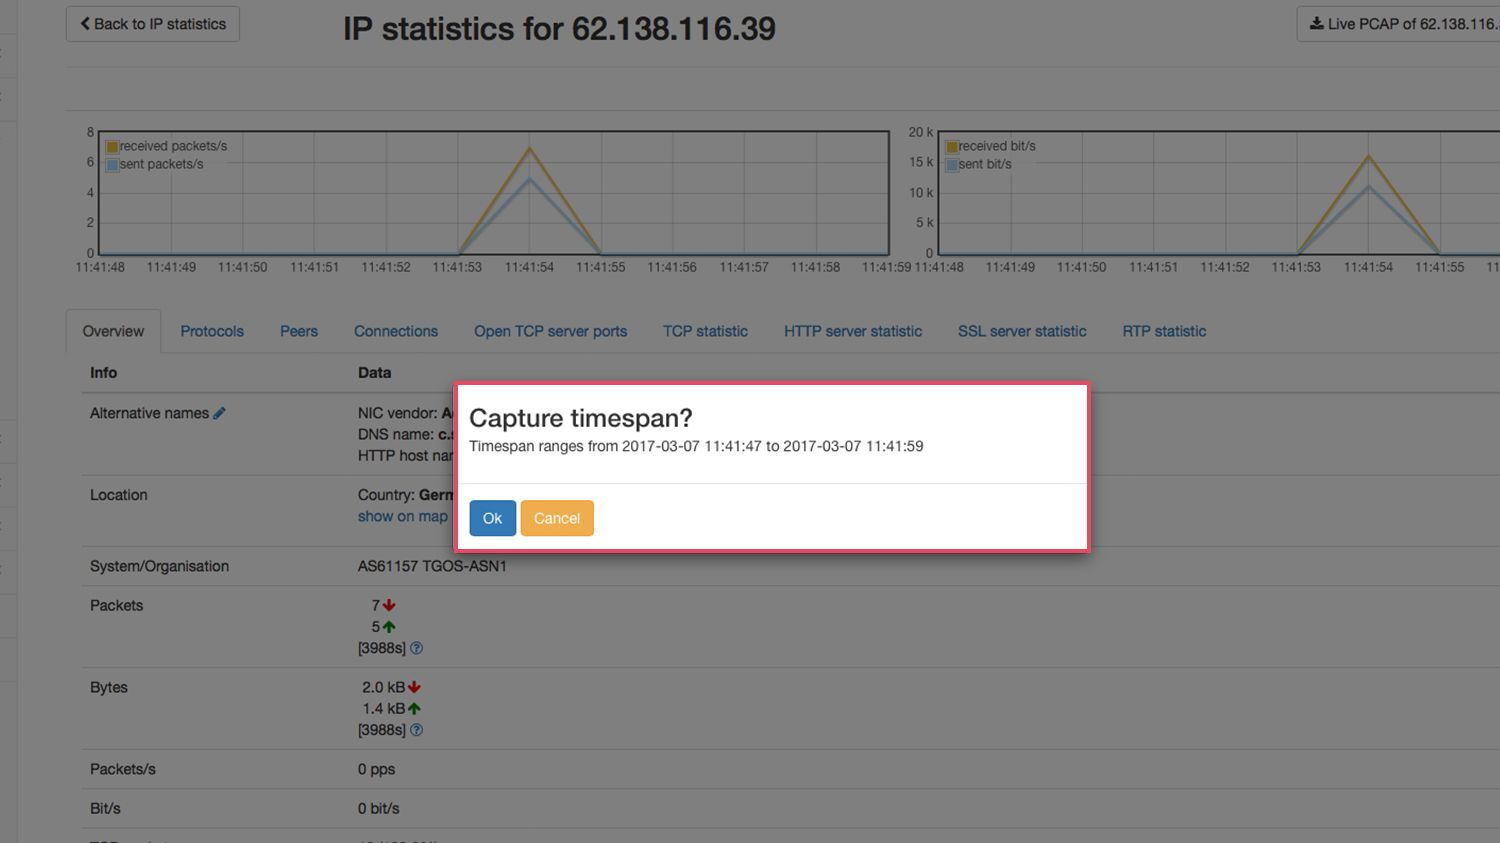
By selecting a specific time interval and activating the ‘Capture Buffer’ feature, all the statistics and graphs displayed in the user interface will refer to this period. Similarly, whenever you press the pcap Download button, a dialogue box will also appear reminding you that all the statistics etc. concern this period.

Our use case provides for the traffic of a specific IP address from a period of time in the past to be obtained as a pcap. Using the ‘IP Statistics’ view under the ‘IP addresses’ tab, you can quickly search for an IP in the full-text search by entering the exact address or a DNS or DHCP name. Clicking on the address found will take you to the overview page for this IP address.


Creating a predefined packet capture

The graphs shown here can easily be used to select the period for packet capture. To start recording, click the ‘Live PCAP of’ button. As soon as the packet has been captured, the download will be made available to you.

You can define the packets to be captured more precisely by selecting the tabs ‘Protocols’, ‘Peers’ or ‘Connections’ beforehand. Your packet capture will then only contain the traffic that the IP exchanged with a certain other IP during the selected period.

All in all, the functions of the Allegro Packet Multimeter provide fast and above all clear access for the analysis of network malfunctions. If a packet capture has been created which only contains the selected part of the network traffic, a detailed analysis can be substantially accelerated with tools such as Wireshark.


Why was the server unavailable at a certain time?

Network malfunctions often occur when you’re not sitting at the computer. But you can still investigate the cause of the error – for the Allegro Network Multimeter makes light work of a historical analysis of network traffic.

Suppose an employee tells you that they often have problems reaching a server, and that the problem last occurred today at about 10am.

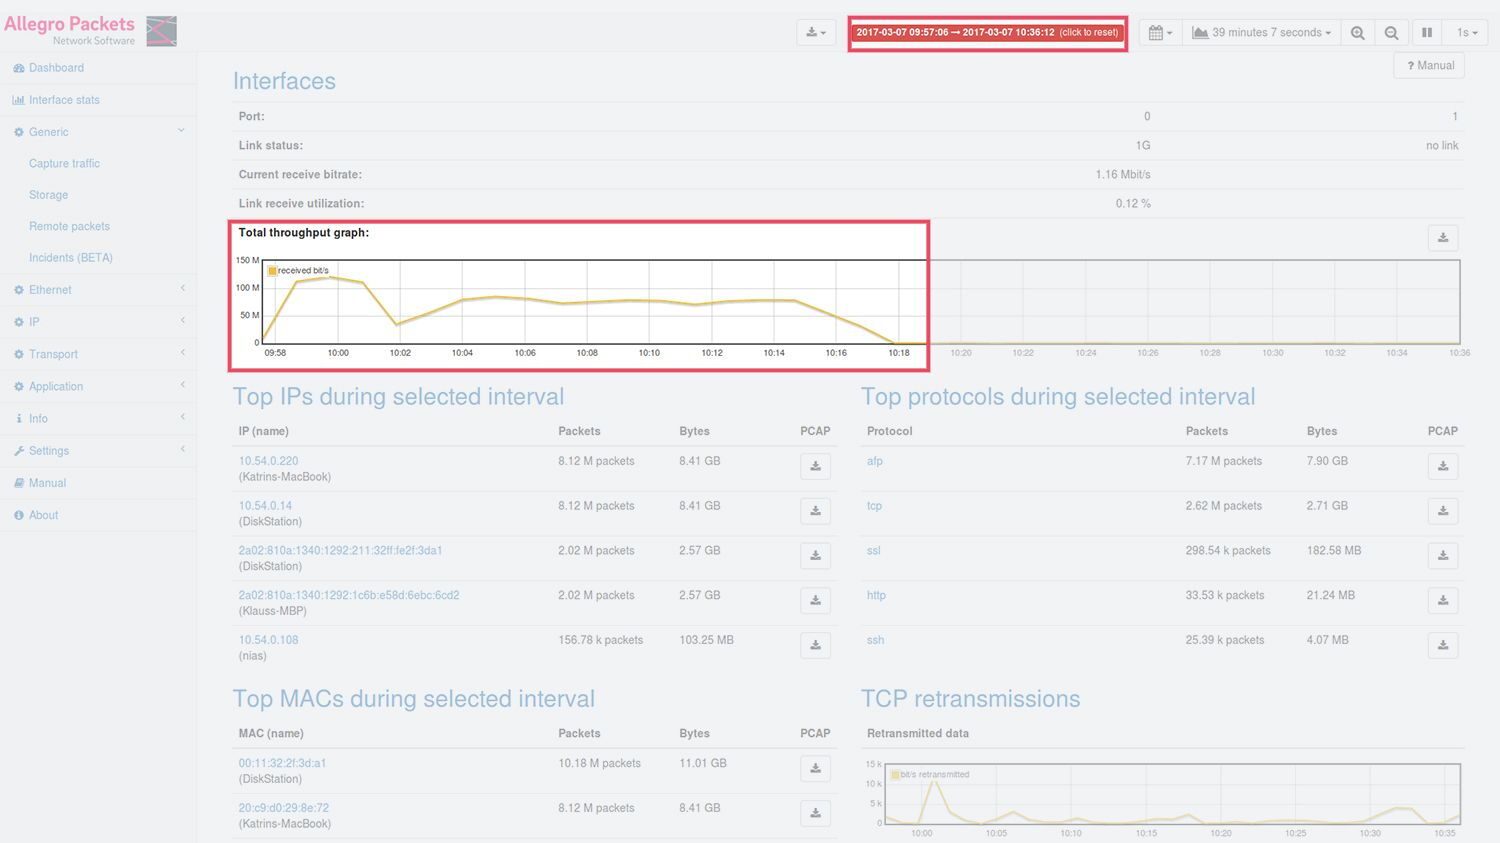
To carry out historical network analysis for this malfunction, the Allegro Network Multimeter has to be installed at a point passed by the employee’s packets on their way to the server. If this is already the case, open the dashboard of the Allegro Network Multimeter in the browser. In the upper section entitled ‘Interfaces’, the network traffic is shown in a graph, initially in real time. Change to the desired time interval by using the integrated calendar selection or the convenient zoom function in the graph, which can be controlled using the mouse wheel and the Ctrl key.


Once a specific time interval has been selected, all the statistics and lists displayed will refer to exactly this period in the recent past. (The time interval can be reset by clicking the reset button next to the calendar selection.)

Starting from this interval, you can now home in on past connections between the employee and the server. In the first step, identify the employee’s computer. To do so, click on ‘IP statistics’ in the menu on the left and search for the name of the employee’s PC or its IP address in the full-text search.

By clicking on the IP address found and on the ‘Peers’ tab, you’ll be shown all the connections that originated from this computer during the relevant period. Note that from 9.50am, no network traffic originated from this employee. Perhaps the network was down?


Historical network analysis of individual PCs or servers

Can you see a connection to the server? Were packets sent and received? Were there many retransmissions? Click on the connections you want to examine more closely and extract a pcap if necessary.

If, during this historical network analysis, you discover that no connection was established with the server, there was probably a problem between it and the employee’s PC. To narrow down the cause of the faulty connection, examine the employee’s other connections during this period. What worked – and what didn’t? What were the response times of individual connections?

Another possible cause of error is the server itself. Using the Allegro Network Multimeter, you can continue your historical network analysis on the server. To do so, repeat the above analysis steps. Look for the server on the ‘IP statistics’ page using the full-text search. Once again, click on ‘Peers’ on the IP address found to display all the connections of the selected server. It can now be seen for instance that although the employee who reported the problem wasn’t able to access the server, some employees were. This reinforces the hunch that the server can be ruled out as a cause and that the problem must have been a network failure.

By continuing in this manner, you can increasingly narrow down the cause of the error and find out more about the cause of the malfunction.


Why was the network so slow this morning

After a long weekend, the system administrator receives several emails from colleagues complaining about the network being sluggish. Network performance suddenly collapsed on Monday morning between 10 and 10.30am. Why?

The cause can easily be found using the Allegro Network Multimeter.

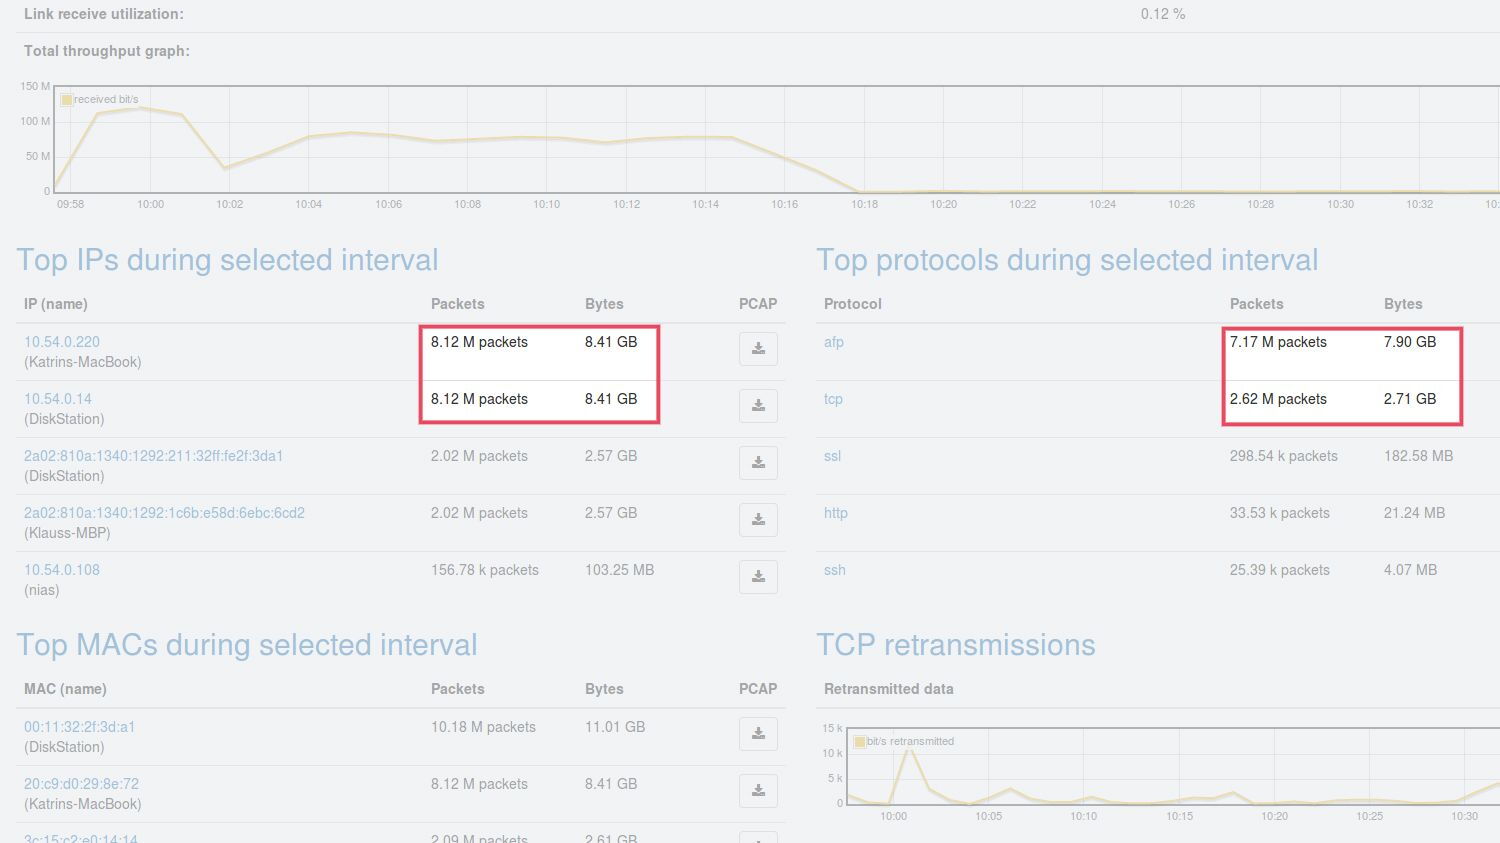
If the multimeter is already installed at a point in the network, simply open the web interface in your browser. First of all, the dashboard is displayed. The current network traffic is shown in the graph at the top of the section called ‘Interfaces’. The sections below are dedicated to the ‘Top IPs’ and the ‘Top protocols’, i.e. a display showing which users and which protocols caused the most network traffic in the past minute.

Enter the desired time interval either by using the integrated calendar selection or the zoom function in the graphs. In the selected time window, very high utilization can now be seen in the graph.


Instead of the most active IP addresses and protocols with the highest traffic in the past minute, the lists ‘Top IPs’ and ‘Top protocols’ now show (as their names suggest) the top IP addresses and the top protocols in the selected period. Note that one IP address and one protocol caused almost all the traffic in this interval. It is hence already evident that a specific user was responsible for an enormous amount of network traffic in this period.


Details on the top IP address

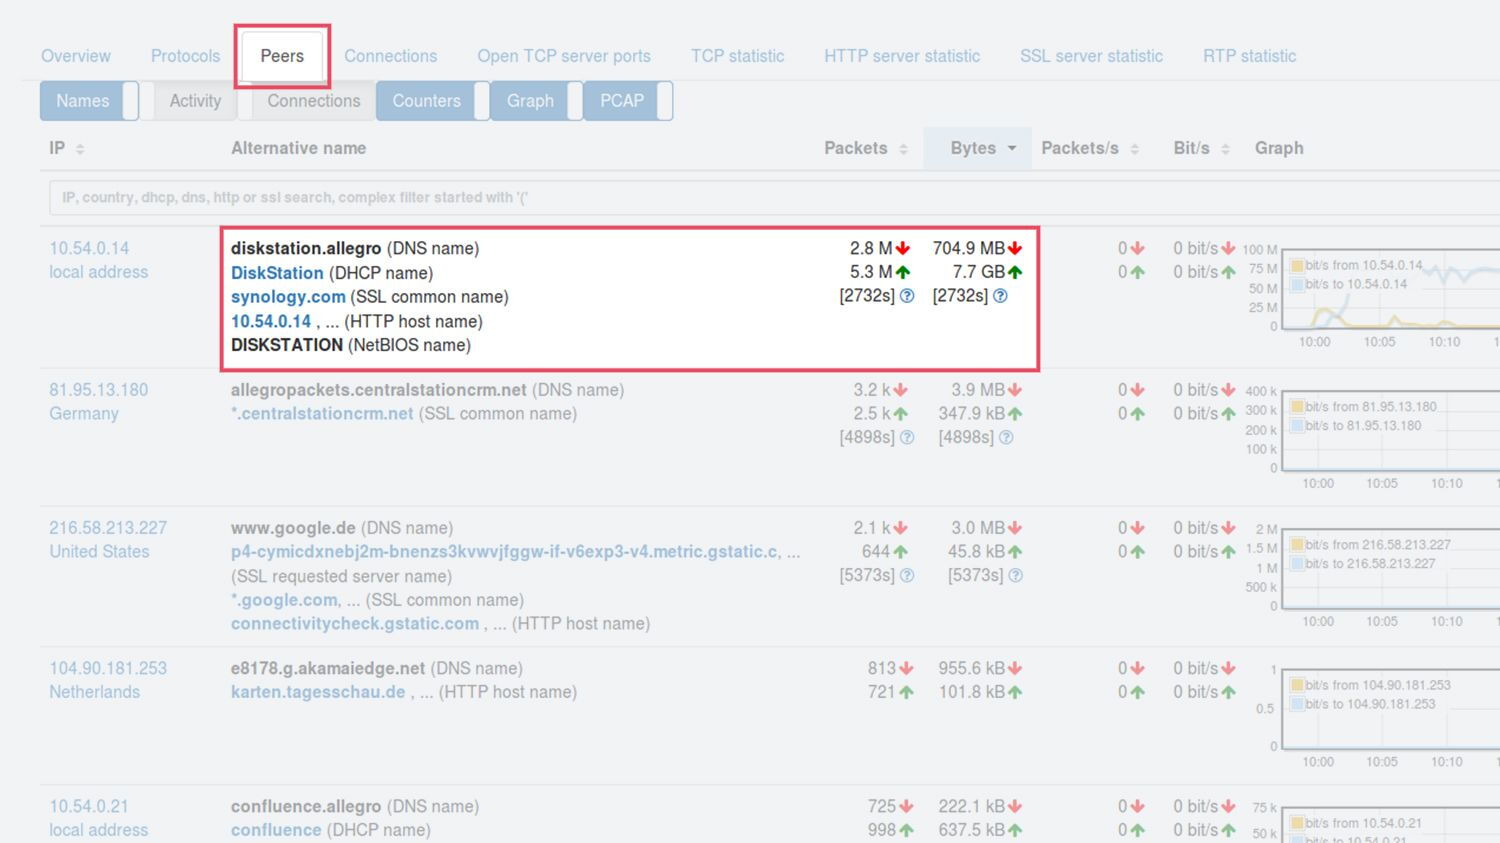
Click on the top IP address to open the detailed view. The name of the user’s PC, its MAC address, and other information will be displayed. By clicking again on the ‘Peers’ tab, all the connections originating from this user are displayed in detail. It turns out that once again the connection to just one peer – in this case a file server named ‘diskstation’ – was responsible for nearly all the traffic.

You now therefore know that one user caused an inordinate amount of traffic and consumed high bandwidth during the period concerned by uploading or downloading data and so probably triggered the problem. If the user isn’t aware of this, an inadvertent time machine backup setting in the MacBook identified in this case may be responsible.